Chapter 5 Gap Analysis
Chapter 5 Gap Analysis. Sources of Gaps Types of Gaps Measures to Close Gaps. Ch. 5 Gap Analysis. Goal: To build the channel that both meets service output demands and does so at a minimum cost of performing the Necessary Channel flows . Gap Analysis Framework:

Chapter 5 Gap Analysis
E N D
Presentation Transcript
Chapter 5Gap Analysis • Sources of Gaps • Types of Gaps • Measures to Close Gaps
Ch. 5Gap Analysis Goal: To build the channel that both meets service output demands and does so at a minimum cost of performing the Necessary Channel flows. Gap Analysis Framework: Sources of Gaps Types of Gaps Closing Gaps
TIMELINE OF CHANGES IN THE AIRLINE TRAVEL CHANNEL 2/11/95: American, Northwest follow 1996: Airlines settle lawsuit, paying agents $86 million; commission caps remain in place. Online ticketing (e-ticketing) begins. 2/10/95: Delta limits agent commissions to $50 on RT, $25 on one-way tickets for U.S. travel 2/16/95: AMEX, Carlson Wagonlit announce fees for travel services 2/17/95: Travel agents file antitrust lawsuit; U.S. Justice Dept. investigation launched 3/29/95: Delta, Continental offer bonuses to travel agents exceeding sales goals 2/13/95: United, USAir follow 2/14/95: Continental follows 2/15/95: TWA follows 2/10/97: SAS, KLM, Lufthansa cut domestic commissions to 5-7.5% 9/18/97: United cuts commissions to 8%, retains $50/$25 caps 11/18/98: American, Delta, United cap commissions on international flights at $100/$50 11/20/98: Continental follows 10/8-12/99: United cuts commissions to 5% with a maximum of $50 for round-trip domestic ticket, $100 for round-trip international flight; American, Delta, Northwest, KLM match 9/26/97: Northwest, Continental, USAir, Midwest Express, KLM, Lufthansa follow 9/23/97: American, Delta follow
I. Sources of Gaps SOURCES OF GAPS Environmental Bounds: - Local legal constraints (ex: CDW) - Local physical and retailing infrastructure (ex: Online Bill Payment)* Managerial Bounds: - Constraint due to lack of knowledge - Constraint due to optimization at a higher level
FIGURE 5-3: ONLINE BILLING AND PAYMENT: A VIRTUOUS CYCLE Note: the B2B process exhibits a similar path, with the added inducement to payers of the development of technologies to integrate bill payment information with back-office (accounts payable, inventory management, and ordering) processes.
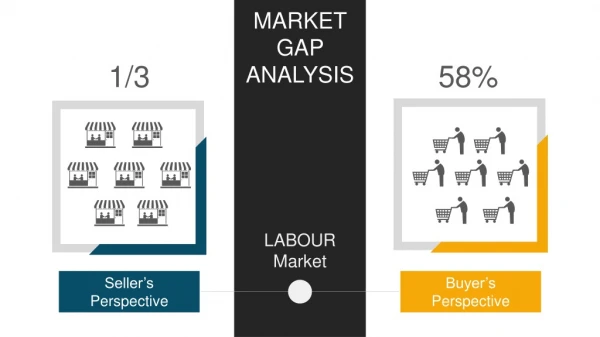
II. Types of Gaps TYPES OF GAPS SOD: Service Output Demanded SOS: Service Output Supplied Demand-Side Gaps: ex) Retail Music Sales SOS < SOD SOS > SOD Which SO(s) ? Supply-Side Gaps: ex) CDW’s Promotion Cost Flow cost is too high Which flow(s)?
TABLE 5-2: AVERAGE RETAIL CD PRICES IN THE U.S. In response to flagging sales, Vivendi Universal dropped price of Music CDs from $16.98 to $12.98 in September 2003.
SERVICE OUTPUT DEMAND: SEGMENT NAME/ DESCRIPTOR BULK BREAKING SPATIAL CONVENIENCE DELIVERY/ WAITING TIME ASSORTMENT/ VARIETY Customer Service 1. 2. 3. 4. 5. SERVICE OUTPUT DEMAND TEMPLATE INSTRUCTIONS: If quantitative marketing-research data are available to enter numerical ratings in each cell, this should be done. If not, an intuitive ranking can be imposed by noting for each segment whether demand for the given service output is high, medium, or low.
III. Closing Gaps CLOSING GAPS Closing Demand-Side Gaps: - Offer tiered service levels - Expand/contract provision of service outputs; ex) Microsoft Media Center PC with HP* (store-within-store) - Change/Fine-tune segment(s) targeted: ex) Specialty grocers’ response to Trader Joe’s Closing Supply-Side Gaps: - Change flow responsibilities of current members - Invest in new low-cost distribution technologies* - Bring in new channel members
FIGURE 5-8: DEMAND-SIDE GAP ANALYSIS TEMPLATE • Notes and directions for using this template: • Enter names and/or descriptions for each segment. • Enter whether SOS>SOD, SOS<SOD, or SOS=SOD for each service output and each segment. Add footnotes to explain entries if necessary. If known and relevant, footnote can record any supply-side gaps that lead to each demand-side gap. • Record major channel used by each segment, i.e., how does this segment of buyers choose to buy?
FIGURE 5-9: SUPPLY-SIDE GAP ANALYSIS TEMPLATE(to be used in conjunction with Demand-SideGap Analysis Template, Figure 5-8) • Notes: • Record routes to market in the channel system. List should include all channels recorded in Figure 5-4 above. Note the segment or segments targeted through each channel. • Summarize channel members and key flows they perform (ideally, link this to the Efficiency Template analysis in Chapter 3). • Note any environmental or managerial bounds facing this channel. • Note all supply-side gaps in this channel, by flow or flows affected. • If known, record techniques currently in use or planned for use to close gaps (or note that no action is planned, and why). • Analyze whether proposed/actual actions have created or will create other gaps.
Ch. 3Building and Editing the Channel Value Chain I: The Key Principles Table 3-2: PC Channel Shipment Share in the U.S.
FIGURE 5-11: SUPPLY-SIDE GAP ANALYSIS TEMPLATE: CDW EXAMPLE(to be used in conjunction with Demand-Side Gap Analysis Template,Figure 5-10) Note: all channel members perform all flows to some extent. Key channel flows of interest are promotion, negotiation, and risking.