Download
1 / 13
130 likes | 250 Views
Cord-cutting trends, enablers and obstacles in the United States. Dr. Ra ú l L. Katz, Adjunct Professor, Division of Finance and Economics, and Director, Business Strategy Research, Columbia Institute of Tele-information. Cord-cutting: Much ado about nothing? November 20, 2013

E N D
Cord-cutting trends, enablers and obstacles in the United States Dr. Raúl L. Katz, Adjunct Professor, Division of Finance and Economics, and Director, Business Strategy Research, Columbia Institute of Tele-information Cord-cutting: Much ado about nothing? November 20, 2013 Trans-Atlantic Communication Dialog
“Much ado about Nothing?” or Beaucoup de bruit pour rien “I have a good eye, uncle; I can see a church by day-light” (Act II, Sc. I): cord-cutting is inexorable; we should better prepare “ Done to death by slanderous tongues ” (Act V, Sc. III): this is just a fallacy of extrapolation from voice cord-cutting
US Pay TV subscribers had been fairly stable between 2009 and 2011, but started declining in 2012 UNITED STATES: PAY TV SUBSCRIBERS (2009-2013) Source: Stifel
Cord-cutting is not the only trend at work in the US video content distribution landscape • Recession and unemployment is still affecting low-end incomes; this trend has affected video distribution, broadband and wireless connectivity • Pay TV fees have been increasing above inflation for the past 15 years (although, obviously, programming options have grown as well); this trend represents a challenge in view of price elasticities and presumed consumer surplus • Video distributors have been engaged in value chain conflicts for quite a while: Satellite and telco players got a boost from programming disputes with cable TV operators (cable has lost 5 points of market share since 4Q09) • Broadband is engaged in an ongoing technology substitution process: Cable continued capturing DSL customers, with the industry capturing 512,000 subscribers
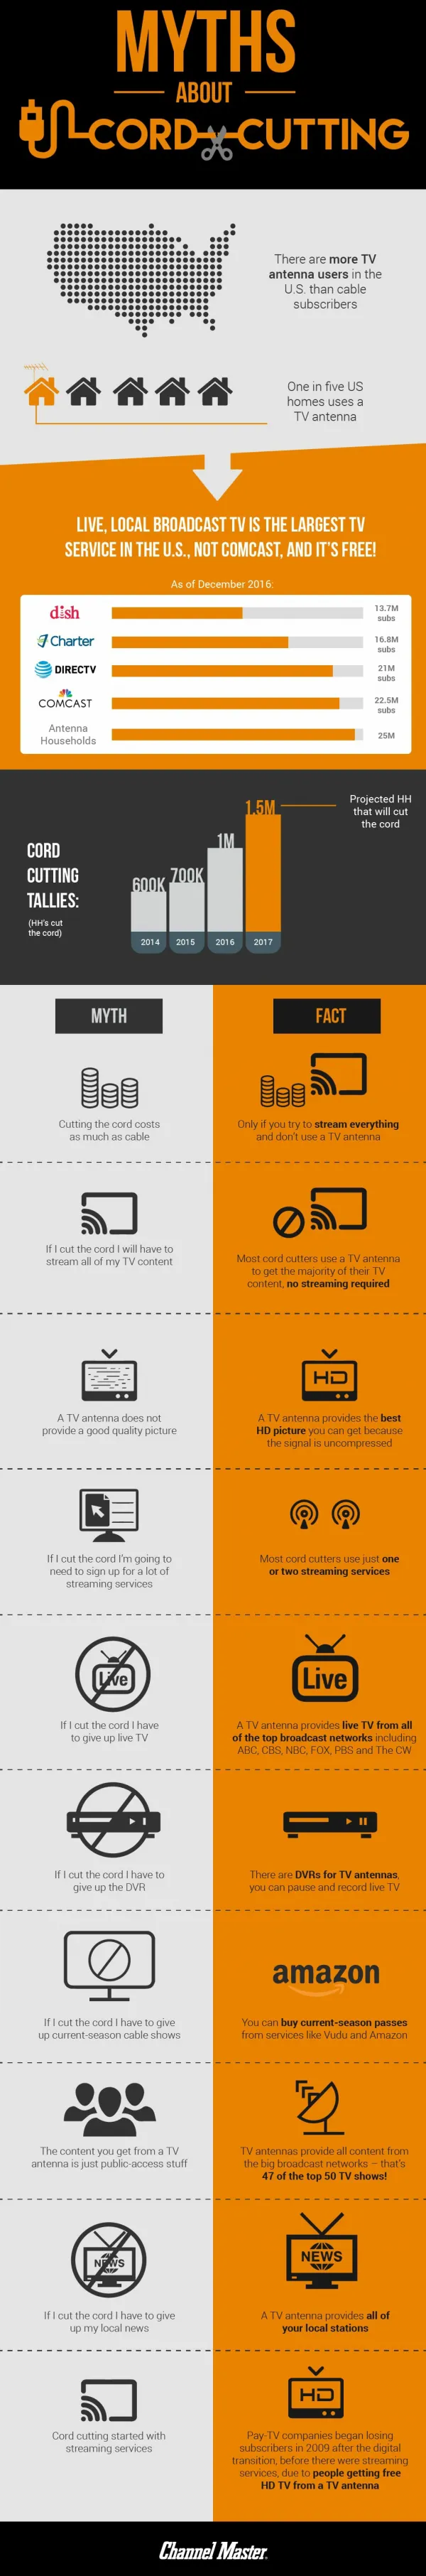
Nevertheless, cord cutting evidence is apparent • Total pay TV subscribers have declined 630,000 since 1Q13 reaching 86.8% penetration in the 3Q12 from 89.2% in 1Q11 (Stifel), 380,000 in 2Q2013 • There are approximately 2 million households(2% of the market) that have cut the cord so far (C. Moffett) Fourth consecutive yearly decline in pay TV subscribers Pay TV subscribers continue lagging house formation which suggests moderate cord-cutting Source: Stifel
The key question is whether we can anticipate the future trend: the video trend will not look like the voice cord-cutting trend UNITED STATES: WIRELESS ONLY HOUSEHOLDS (2003-12) Source: National Institute of Health; Morgan Stanley
Accelerator I: cost of pay TV services • The monthly rate for Pay TV has been rising at an average 6.3% annually since 1995 (compared to 0% to 4% inflation rates) reaching $86 in 2011 ($65 for pay TV service and $21 for premium channels) • The rising fees have been driven by the increase in licensing fees (growing at 8% to 11% per year, primarily driven by sports), technology spending, and drop in advertising spend • By 2015, pay TV monthly fee will reach an average of $123, testing consumers’ willingness to pay PROGRAMMING COSTS Source: Commpany Reports
Accelerator II: Netflix and Hulu represent a gateway to OTT • 27 million Netflix and 40 million Hulu Plus subscribers in 2013; 54 million global Internet-enabled set-top boxes (Xbox, PS3, TIVo, Slingbox, Vudu, Roku +59% Y/Y • Consumers begin supplementing their pay TV service with Netflix and Hulu (of all pay TV subscribers 27% also subscribe to Netflix,and 46% also pay for a premium channel • Of all pay TV subscribers, 24% watch movies via paid and free VOD • 73% of Netflix subscribers streamed video for free NETFLIX US: SUBSCRIBERS AND ARPU HULU PLUS PAYING SUBSCRIBERS
Brake I: OTT is not for everyone: resilient non-adopters (older, wealthier and sports fans) • A growing percentage of newly minted graduates and young professionals are foregoing cable and satellite, and merely getting broadband at home • Rather than paying $50 to $80 per month for video, these consumers are opting for broadband at $40 / month and cobbling together video from a variety of sources • While Internet delivered video largely lacks access to news and sports programming, the technology does enable 1) the potential for cost savings, 2) anytime, anywhere on demand access and 3) vastly better title search and discovery features • But older households are more reluctant (media consumption behavior is different; complexity of technology interface) • Analogous to voice cost-cutting: The percentage of adults living in households with only wireless telephones decreased as age increased beyond 35 years: 39.1% for those aged 35–44; 25.8% for those aged 45–64; and 10.5% for those aged 65 and over • Rural/urban split?
Brake II: Traditional Content Distributors have prevented the development of a complete OTT substitute • OTT is not a one-to-one substitute to pay TV (no availability of all popular shows, no live programming (sports or news) • Pay TV operators have been successful in keeping content agreements for live programming exclusive to traditional systems • Cable TV networks have retaliated with TV anywhere, and will implement metered bandwidth pricing regulatory issue), and the aggregate fees will not increase as much as in the past • The stock market continues rewarding pay TV players RELATIVE PERFORMANCE OF PAY TV STOCKS Source: Hudson Square
What is the outlook like? Value chain differentials could lead to extrapolation fallacies, particularly in the medium term ORIGINAL MUSIC VALUE CHAIN (CDs) 60% 25% $ 15 15% Artist Record Label Retailer Consumer VIDEO VALUE CHAIN 33 % 20 % $ 86 46 % Programs Cable COGS Margin Consumer 53 %
What is the outlook like? Winners and losers in the long run • While not everyone will cancel (e.g. sports fans probably won’t), it doesn’t take much to impact the industry: each 1% of households that cancel their cable in favor of over-the-top video will destroy $1.5-$2.5 billion in value for the industry • Winners: High speed broadband providers • Telcos (Verizon FiOS, ATT U-verse): defending high bandwidth is easier than voice • Cable MSOs (with DOCSIS 3.0) • Companies providing time-sensitive programming (Sports (ESPN, regional sport affiliates); Cable news (CNN, Fox News, MSNBC); Providers of very specific original programming broadcast at certain times) • The transport players that facilitate streaming • Losers: Pure play video providers • Satellite operators (Direct TV, and Dish) (if they do not succeed in unbundling sports programming) • Producers of niche programming that get squeezed out in an “a la carte” environment • Cable networks dependent on syndicated programming (e.g. Seinfeld reruns, Law & Order)