Mastering Deception: Crafting Misleading Statistics in Six Steps
Ever wondered how professionals sway opinions using statistics? This guide outlines six easy steps to create misleading statistics that can effectively deceive your audience. Learn to use biased samples and questions, ask misleading queries, and craft deceptive graphs. Understand the difference between correlation and causation, and how precision in numbers can mislead. Whether you aim to sway public opinion or create support for your cause, this resource provides insights into the art of manipulation through statistics.


Mastering Deception: Crafting Misleading Statistics in Six Steps
E N D
Presentation Transcript
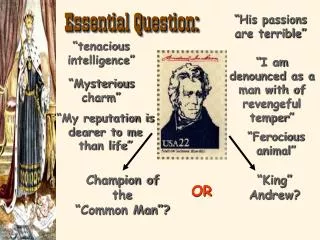
“Question Everything” - Euripides
Don’t Be A Fool Project Want to deceive people? Here’s how the professionals do it: How to Create Misleading Statistics in 6 Easy Steps!
1. Do a survey and use a biased sample population People focus on the survey result and seldom pay attention to information about your sample population. So feel free to bias your result by surveying people you know will answer the way you want. EX: Want a survey result that shows a majority of people favoring smoking in public? Just ask smokers. Want a strong statistic showing approval for your new system? Just ask people who you know are on your side.
2. Use biased questions in your survey Your can further strengthen your survey results by asking biased questions which make the survey respondent more likely to answer the question the way you want. Political organizations are masters of this. EX: Want to show approval for guns? Just ask a question like, “In these days of increasingly frequent home invasions, do you feel that having a gun in the house would help your personal defense?” (and don’t forget step 1 and use gun owners as your survey population). You’ll get an amazingly strong show of support for guns.
3. Ask the wrong question You can often support your cause by asking the wrong question (the one that’s not quite as relevant to your desired result), and then answering it in a way that implies something you want. For example, if you want to show public support for a war, then ask a survey question about supporting the troops (which is, after all, an entirely different thing). If you want to hide the fact that you’ve got occasional critical system downtime, then show overall system uptime — those system failures will be lost in the statistical noise. If you want to show high consumer interest in product A, then ask consumers about A versus C, where C is a not-so-popular alternative. But don’t ask consumers about A versus B, where B is A’s closest competitor.
4. Use misleading graphs If you want to show high variability in a statistic, then chop off the bottom of the graph and just show the top (for example, using a y axis of 5,000 to 5,001 instead of 1 to 5,000). This magnifies the area you’re interested in, and makes small variations look like huge peaks and valleys. On the other hand, if you want to show stability in a statistic, then make sure you show the full x axis (e.g., from 1 to 5,000), and make the graph as small as possible to minimize the appearance of variation. And you already know plenty of other ways!
5. Imply cause and effect when you only have correlation Two factors can often be correlated without any cause and effect relationship. Both factors can be caused by a totally different factor, or the cause and effect can even be backwards from what’s being implied or stated (i.e., B causes A instead of A causing B). For example, I once saw a claim that older people who walk are more likely to live longer. That may be true, but it’s also just as likely that older people who are sick and can’t walk are more likely to die sooner. So maybe the walking isn’t the cause — maybe the ability to walk is just an indication of continued good health.
6. Make your results more precise A number with higher precision gives the impression of being more accurate. If I say that 91.3% of system users are happy, it sounds more accurate than 90% of users, even if both numbers are made up. In the old advertising campaign, Ivory soap was touted as “99 44/100% pure” (pure what?). People trust precise numbers because they sound more scientific, but that doesn’t mean the numbers are correct.
Meet Survey Monkey http://www.surveymonkey.com/ is a website with free software to create your web-surveys You will need to create an account using your email address Once you’ve created your account, you will create a 10-question web-survey with the express purpose of misleading your survey takers When you’re survey is finished, email the link to brigitte.warner@gmail.com so I can post it online for people to take your survey
10-question web-survey • A variety of question types such as multiple choice and rating scale • Effort made to bias your survey results • A creative, yet cohesive topic for your survey RUBRIC _______/50pts