Download

1 / 29
290 likes | 408 Views
The Electromagnetic Calorimeter (EC) at SciBooNE. C. Mariani (Columbia University) for the SciBooNE collaboration. Outline. SciBooNE: Motivation; Configuration; EC @ SciBooNE; EC description: support structure; module configuration; DAQ and HV system; Online monitoring;

E N D
The Electromagnetic Calorimeter (EC) at SciBooNE C. Mariani (Columbia University) for the SciBooNE collaboration
Outline • SciBooNE: • Motivation; • Configuration; • EC @ SciBooNE; • EC description: • support structure; • module configuration; • DAQ and HV system; • Online monitoring; • Calibration
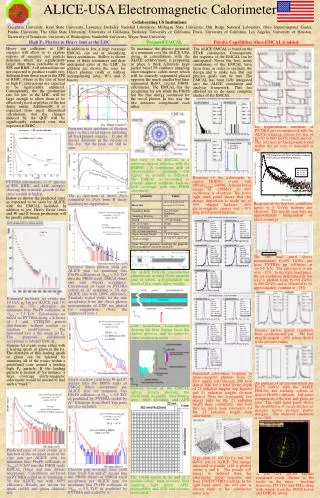
Physics motivation • imperative for future • osc exps to precisely • predict signal & bkgd rates • - will be more sensitive • to sources of systematic error • increased interest in • more precise sn meas • interesting nuclear effects • expected in this E region • (shadowing in the nucleus, low Q2) • new data from MiniBooNE • & K2K shedding light on this • More data at 1GeV with fine • grained resolution will • complete the picture sn in this E range interesting: QE DIS 1p MINOS, NuMI K2K, NOvA MiniBooNE, T2K Super-K atmospheric n
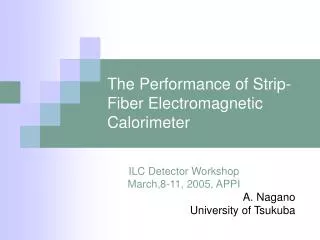
SciBooNE configuration MiniBooNE beamline SciBar Decay region MiniBooNE Detector 25 m SciBar (4 X0) (Fiducial:10t) 50 m 450 m 4m 3m n 3.5m MRD 3m 1.7m Ecal (11X0) 1m • 100m from the target • On-axis position • (1~2)x1019 POT/month
EC motivations Physics capabilities Longitudinal containment (85% at 3GeV); Energy reconstruction for electrons and gammas; Electron vs (muon or pion) ID po reconstruction; Physics output ne energy spectrum po cross-section and spectrum Enhance PID and event classification Physics goal Longitudinal energy flow containment Electrons and photons final states
EC results@K2K ne flux Phys. Rev. D74:072003, 2006 Phys. Rev. D in preparation
EC – Electromagnetic calorimeter (University of Rome “La Sapienza” and INFN Roma)
Module configuration • Spaghetti calorimeter: • 1 mm scintillating fibers in grooves of lead foils 1 mm thick; • Scintillating fibers (Kuraray SCS-F81), 500 cm attenuation length; • Ratio fiber/lead 1:4 (in volume); • Module dimension (4x8cm2x265cm): • 4x4 cm2 readout cells, read from both ends; 4 cm 265 cm 8 cm 4 cm Readout cells The modules were originally build by INFN for CHORUS(1992) and then re-used by the HARP experiment at CERN, K2K at KEK (Japan) and now SciBooNE at Fermilab.
CALORIMETER MODULE'S TRAVELS... KEK FERMILAB K2K (2003) SciBooNE (2007) CHORUS (1993) HARP (2001) CERN INFN
2 readout cell from both ends: • Hexagonal light guides; • Yellow filters (Kodak Wratten 6); • Hamamatsu R1355/SM (green extended); • Signal readout through differential pairs cable 100m long; Fiber bundle PMT & HV divider Light guide
Support Structure • 64 “spaghetti” calorimeter modules (4x8cm2x265cm): • 32 horizontal and 32 vertical modules;
DAQ system EC logic (conceptual) Event number SciBar Trig. ID Trigger and Trig. ID NIM PC VME Busy signal ADC Gate Read Out Busy clear Busy clear ADC Readout logic
Three trigger signals: • Cosmic; • Pedestal; • Beam data; • DAQ: • Acquisition time < 1ms; • Acquisition rate up to 1.5 kHz; • 8 QDCs (Caen V792): • 12 bit resolution; • 5.7 ms/ch conversion time; • 600 ns fast clear time;
HV system EC HV system 2 mainframes CAEN SY527 + 16 HV cards CAEN A734N Load setting Control room PC Alarm and warning monitor
HV system • SMACS server (SciBooNE enclosure): • Perform cyclic read out of the all system (< 1s) to get status of each channel, readout voltages and current; • All “HV events” are logged in a local DB; • A tree browser allow navigation of the HV channels, a led represent the status of each channel; • Selecting a channel from the browser, the status voltage, current and their time plots are accessible through tabs; • Individual channel setting can be changed interactively; • SMACS client (control room): • Client-server communication (ASCII strings through winsock); • Multiple clients can run simultaneously; • Map display of pmt online status (green/yellow/red: ok/warning/alarm); • Double left-click on a pmt shows set/monitored voltage and current and online condition; • Cannot modify HV setting; SMACS = Slow Monitor And Control System. Visual basic software interface originally developed by INFN Roma for the CDF-TOF system
Server: • Map display of pmt status like the client side; • Double click on client windows on a channel to get status and set/monitored voltage, current, change setting and turn on/off channel; • Monitor the number of clients connected to the server.
Monitoring Client (SciBooNE CR): • Map display of pmt status; • Double click on a channel to get status; • Alarm window automatic pop-up; • Send email and call pager; • Window logging past allarm; • Green Channels are ok; • Yellow channel: warning; • Red channel: alarm Double click: status
Online monitoring • Monitor in real time (for cosmic trigger and beam trigger): • ADC hitmap; • Average deposited energy for each channel;
Before installing • The detector was fully installed in an assembly area before transportation to the detector enclosure. Commissioning with cosmic ray data provided: • HV adjustment of the 256 channels; • Equalization of the response of all the 64 modules; • Measurement of the number of PE; • Measuring the attenuation length of fibers in each of the 64 modules; • After the installation in the SciBooNE enclosure we monitor constantly: • Pedestal absolute value and pedestal width (every 10 minutes); • Energy deposited by cosmic muons Gain of each channel; • Voltage and current of each PMT channel;
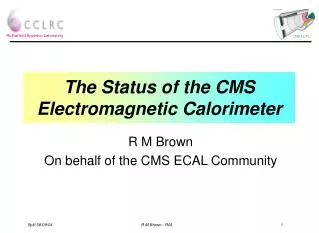
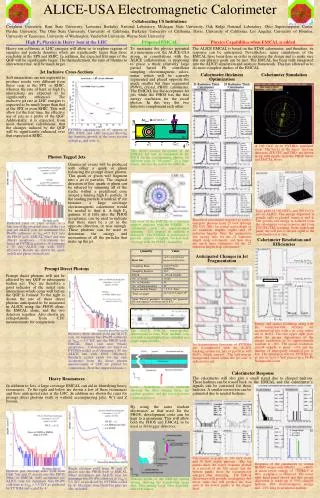
Pulse height distribution Before HV adjustment After HV adjustment Spread = 10% Spread = 22% After equalization, spread < 1% Number of PE = 10.4 on average
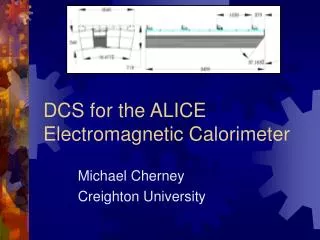
Distribution of the attenuation length In 1992 the measured attenuation length in CHORUS was around 500 cm, after 15 years result to be around 400 cm
Reconstructed muons energy loss (data) MIP energy loss in both the EC planes (Horizontal + Vertical) using cosmic rays SciBooNE data E = sqrt(ADC1ADC2) x InterCalib x Abs.Calib x C_Att.Length.
MC simulation • In order to simulate the response of the EC detectors, the GEANT4 package is used to simulate the detector geometry and the interactions and tracking of particles. • The energy loss of a particle in each individual EC sensitive fiber is simulated. • The energy deposition is converted in the detector response taking into account effects like: • the light attenuation along the fibers; • the Poisson fluctuation of the number of photo electrons; • the PMT resolution; • the electronic noise.
DATA-MC agreement for the ADC distribution Claudio Giganti, Tesi di Laurea (2007), Universita' di Roma "La Sapienza"
Muon dE/dx energy resolution We studied the energy resolution ((E)/Etrue) for the dE/dx of cosmic muons as a function of Etrue. To obtain (E)/Etrue we computed, for each bin, the width of the distribution [(Erec * Cabs) – Etrue] and we divided this value for the mean value of Etrue. <dE/dx>MIP= 106 MeV s(E) = 21.5 MeV
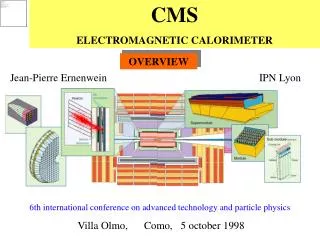
Ce/ and Energy resolution for electrons in the MC To study the response of the EC we sum up the energy in all the EC modules and we compare the reconstructed and true energy. For the reconstructed energy we use the absolute calibration measured for cosmic ray muons C Ce/ = 1.19 ± 0.07 The resolution for electron was measured 13%/sqrt(E) in a test beam at CERN for the Chorus experiment
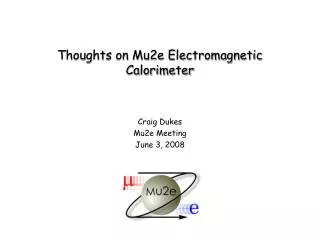
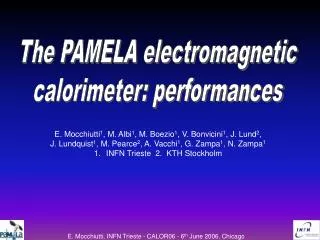
Candidate SciBooNE NC neutrino interaction with a p0 production in the final state