Download
1 / 5
50 likes | 141 Views
Comprehensive analysis of the $11.5 billion flat glass market, major players, manufacturing process, economic factors, and industry trends contributing to total return to shareholders.

E N D
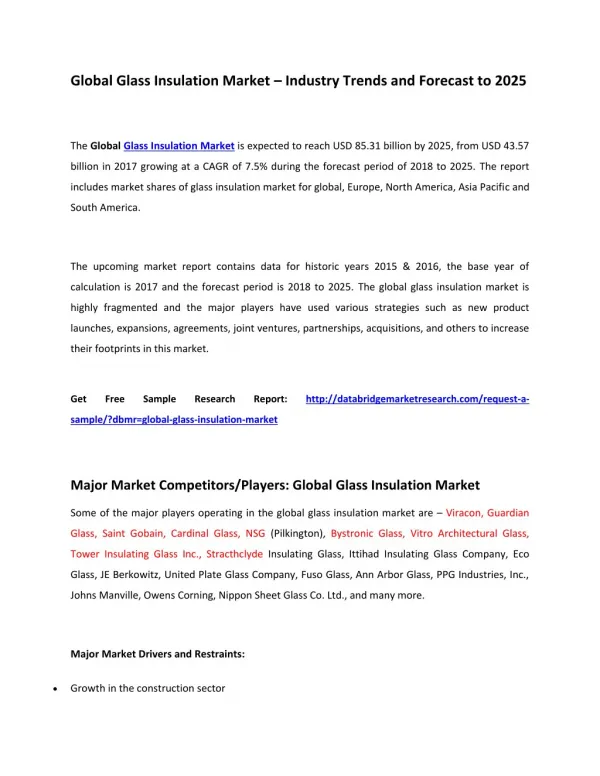
txho/enx119/01211 doc 1 enx119.ppt 10/9/2014 10:34 PM CONFIDENTIAL Global Glass Market Overview ENRON December 11, 2000 This report is solely for the use of client personnel. No part of it may be circulated, quoted, or reproduced for distribution outside the client organization without prior written approval from McKinsey & Company. This material was used by McKinsey & Company during an oral presentation; it is not a complete record of the discussion.
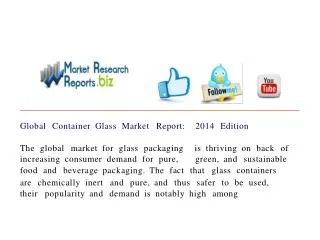
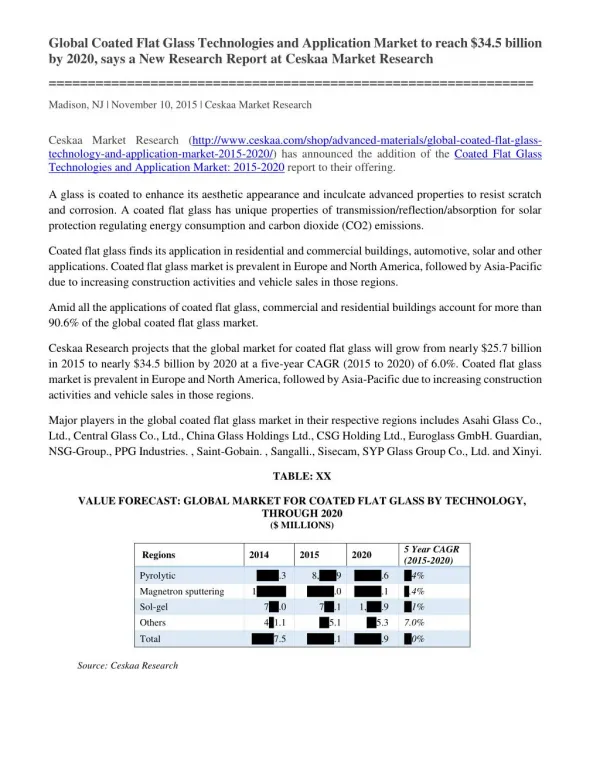
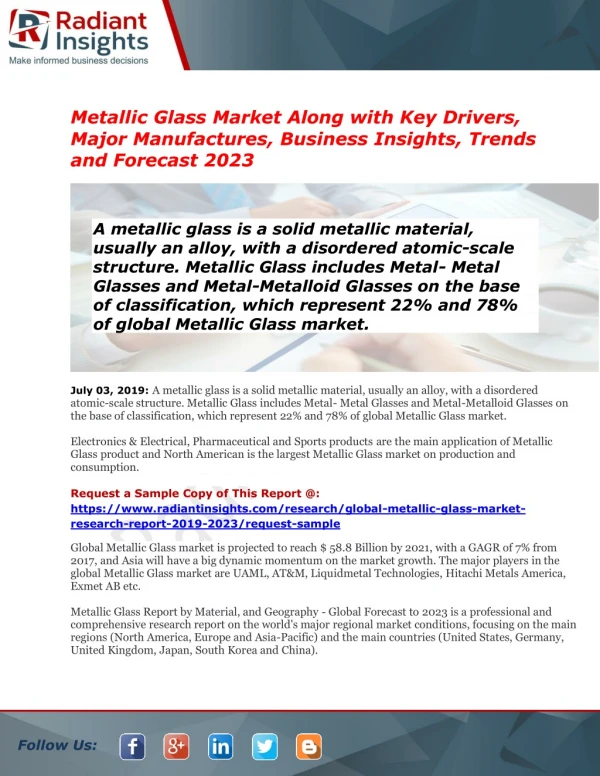
txho/enx119/01211 doc 1 enx119.ppt GLOBAL FLAT GLASS MARKET OVERVIEW • Global glass market • 100% = $11.5 billion • Flat glass cost structures • Percent • Aircraft and other • Other • Energy • Shipping • Auto OEM • Profit margin • Auto • rep • SG&A • Packaging • Raw materials • Labor • Flat glass • (construction) • 140 of 171 glass tanks are in Asia/Pacific, Western Europe, and North America • Margins can be higher for cost advantaged manufacturers or other value-added products • 5 players control 75% of the world flat glass market (Pilkington – UK; Asahi – Japan; St. Gobain – France; PPG – U.S.; Guardian – U.S.) but other players are important in certain regions • GDP is the most reliable indicator of flat glass demand for any region (U.S. market correlation – R2 = .83), thus industry is very cyclical • Markets tend to be regional because of high shipping and packaging costs; flat glass is rarely shipped more than 500 miles • Flat glass PPI shows that prices are not very volatile Source: Analyst reports; U.S. Department of Commerce; Hoover’s
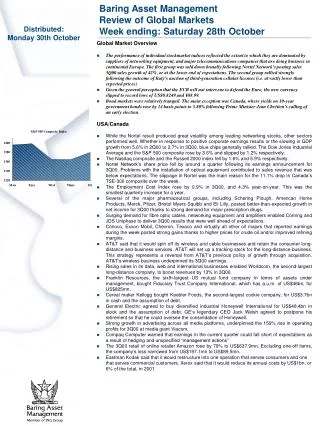
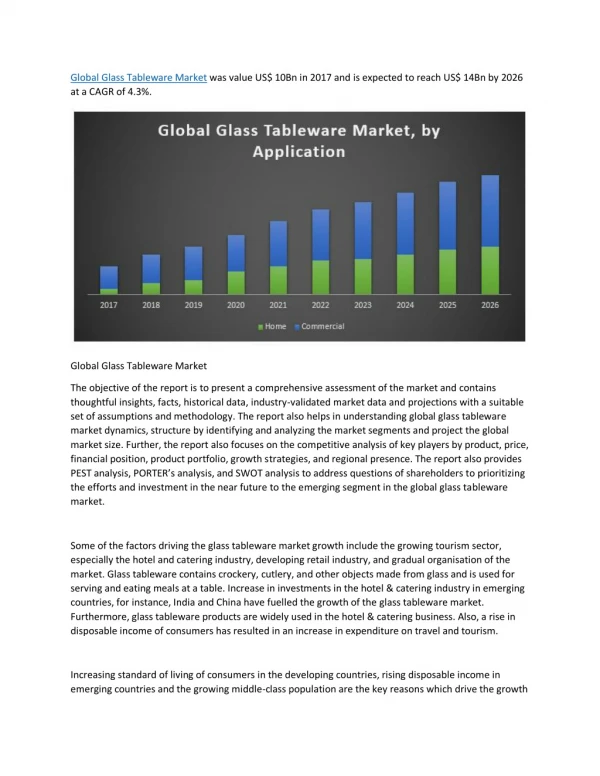
Furnace • Float bath • Molding • Coating/cooling • Finishing • Raw material feed txho/enx119/01211 doc 1 enx119.ppt FLAT GLASS MANUFACTURING PROCESS • 65% sand • 20% soda ash • 15% limestone and other additives • Mixture is melted at 1,600° C • Impurities are removed • Uniform consistency is achieved • If glass is to be shaped (e.g., automotive glass), it is done at 600° C • Any chemicals coatings are applied • Glass is coated in a 200° C furnace • Glass is cut to specifications and prepared for shipping • Economics of flat glass production • High capital requirements ($100 million-110 million for 1 float tank) and long lead time for plants to be constructed • Very high production start-up costs (because of heat needed at all stages of production) requires plants to be operated continuously • Production can be slowed but utilization below 70% is not economical while greater than 90% is desired • Continuous operation and long lead time for capacity addition lead to stable supply • Cyclical demand combined with stable supply leads to some margin volatility • Producers try to counter this through innovative, value-added products • Large buyers (e.g., U.S. automakers) exert buying power (Ford produces some of it own glass) Source: Analyst reports; U.S. Department of Commerce
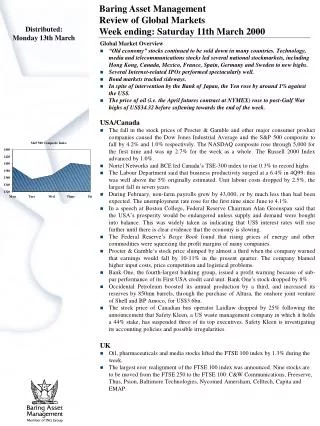
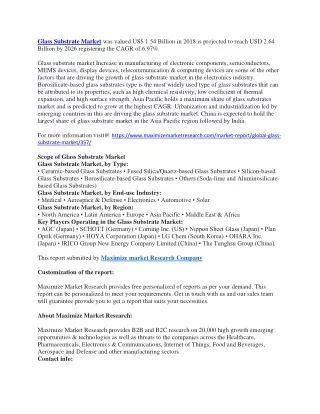
txho/enx119/01211 doc 1 enx119.ppt 20 YEAR PPI FOR GLASS • Monthly PPI • The relatively stable prices are likely a result of limited charges in the manufacturing process. Pilkington developed the current process in the late 1970s • 1/80 • 1/82 • 1/84 • 1/86 • 1/88 • 1/90 • 1/92 • 1/94 • 1/96 • 1/98 • 1/00 Source: Boardview; Bureau of Labor Statistics
txho/enx119/01211 doc 1 enx119.ppt TOTAL RETURN TO SHAREHOLDERS FOR SELECTED PLAYERS • Annual TRS performance • Percent • Market cap • $ Billions • 1 year • 3 years • 5 years • PPG • 7.30 • Apogee Enterprises • .14 • Pilkington • 1.50 • Asahi Glass • 11.30 • St. Gobain • 0.40 Source: Bloomberg; Compustat