Download
1 / 59
590 likes | 685 Views
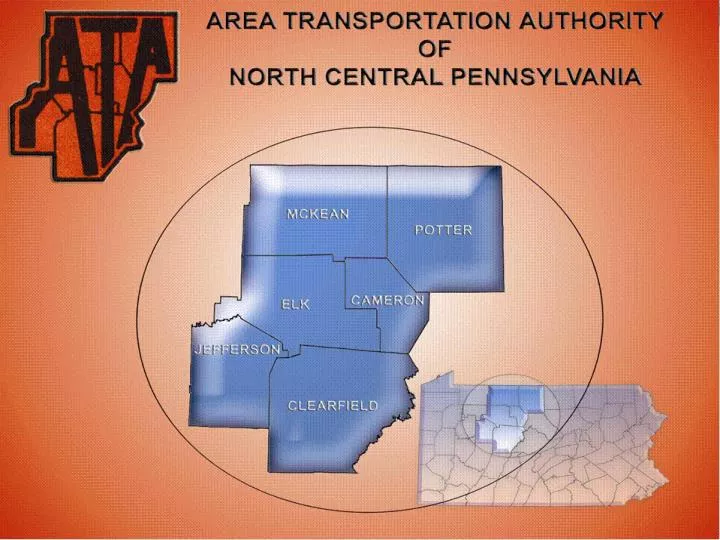
Our Mission. To provide a reasonable level of safe, reliable, convenient, and affordable public transportation to the region’s residents. Regional Overview. Six counties with rugged terrain located in north west-central Pennsylvania

E N D
Our Mission To provide a reasonable level of safe, reliable, convenient, and affordable public transportation to the region’s residents
Regional Overview • Six counties with rugged terrain located in north west-central Pennsylvania • 5,091 square mile service area (larger than 5 of our nations states) • 224,780 residents • Geographically dispersed population of 44 persons per square mile • 156 municipalities with widely ranging features • Population dispersed along 7,000 miles of roads
The poorer socio-economic conditions of the region contribute to a high rate of transit dependency by individuals who are less able to afford transportation needed to access basic services
Factors Contributing to a High Degree of Transit Dependency in North Central Pennsylvania • Older(18.8% of region pop is over 65, 15.4% for state average) • Lower education levels (while increasing, still below state average in both high school and post graduate education) • Lower earnings (counties’ median household incomes range from 6% to 22% less than Pennsylvania and is, on average 5% lower in 2010 than in 2000)
Factors Contributing to a High Degree of Transit Dependency in North Central Pennsylvania • The number of persons living below poverty increased significantly since 2000 • (increased by 114% in Elk County (highest); and 56% in Clearfield County (lowest) • Percent of population below poverty increased from 8.1% to 14% • High percentage of individuals with a disability over the age of 20 (2000 census) • 41.3% over the age of 65 has a disability • 18.4% between the ages of 20-64 has a disability
Operational Overview • Local and area service provided in 36 “core” municipalities and 78 surrounding townships • 40 inter-community “connecting” routes • Demand Response services (shared-ride) provided in all six counties • ATA’s shared-ride program provides the ADA complimentary paratransit
Staffing Organization • ATA current has 157 employees • 89% of the employees are involved in operations/maintenance • Operators are primarily part time with limited benefits
Staffing Organization • Additional Positions budgeted for FY12 • Mobility Manager • Marketing Assistant • Transit Analyst • Fiscal Clerk • Special Projects Coordinator
Additional Positions Budgeted • Mobility Manager - Line supervisor to manage day-to-day issues/concerns and intercommunications between the Call Center (reservations/dispatching) with the Customer Service Center. The mobility manager will provide daily supervision and will assist in determining the best mobility options for riders. • Marketing Assistant - will assist in the promotion of existing and new/expanded routes, assist in keeping the website up-to-date, internal and externally distributed communiques, and will be involved in promotional events, speaking engagements, etc.
Additional Positions Budgeted • Transit Analyst - will analyze route and system performance and investigate causes for performances that do not meet or exceed acceptable thresholds. • Staff for special project coordination – will address management of special projects such as the bus shelter/bus stop sign program, van pool program, university bus transportation, etc. (One FTE position budgeted) • Accounting Clerk – will provide additional staff support needed for general accounting functions
Comparison of Wages of Operators/Mechanics to Industry Average • ATA’s current starting rate for drivers is 75% of the 2009 industry average of $12.93 • ATA’s current starting rate for 1st class mechanic is 80% of the 2009 industry average of $19.95 • ATA’s current starting rate for it’s lowest paid maintenance personnel is 70% of the 2009 industry average of $12.76
Benefits of Operators/Mechanics Comparison to Industry Average • ATA drivers/mechanics do not enjoy as good of a benefit schedule as an average operator/mechanic in the industry. This is most apparent in earned leave, holidays and in retirement benefits • An operator who works for ATA for 30 years will be paid approximately $307 a month, as compared to the industry average of $1542 (20%)
Benefits of Operators/Mechanics Comparison to Industry Average
Pension/Retirement • ATA has a Defined Contribution pension program • Contributions are low at 5% • Funding a defined contribution program is not the issue it is for a defined benefit program
Fuel • At time of Budgeting • Market Rate (at time of budget 5/2011)$4.19 • Budgeted Rate $4.69 • Current Cost of Diesel per Gallon • market rate $3.44 • Pump rate $3.99
Fuel • Amount of Fuel is determined by calculating the anticipated number of gallons based upon average consumption (mpg) for the projected number of vehicle miles to be operated. • The budget rate used to determine the fuel line-item is not based on a scientific model. The calculation is made reviewing recent trends in fuel pricing. • ATA vehicles are dispersed over a wide region and generally do not fuel at a transit owned fueling station preventing the purchase of fuel in annual contract arrangements.
Fixed Route Fares Provide average fare • Current Amount $1.28 • Future Amount $1.42
Fixed Route Fare Policy • $.10 per passenger mile • Minimum fare $1.25 • Youth Fares are 50%
RD Fare Policy • Inter Community RD • $.18 per p/mile • $1.25 minimum fare • $1.00 convenience fare • Youth Fares are 50%
Call-a-Bus/County Wide Fare Policy • Base Fare $3.50 • CAB zonal charge - $.50 per zone crossing • CWS zonal charge - $3.00 per zone crossing • Youth Fares are 50%
Cost of Health Care • Health Insurance • FY 12 proposed increases originally 19.05%, final 6% • FY11 proposed increases 13%, final 9% • What does the future hold? • Highmark & UPMC? • Health Insurance Pool? • Purchase from State?
Cost of Fuel • Fuel • Predictability? • 9/2010 to 9/2011 variance 34% in CPI item ‘motor fuel’ • Average monthly increase is 2.51% in the same period • 12 month variances since September 2010 range from 4% to 38%
Other Threats/Challenges • Labor pool (Marcellus Shale/Utica impacts on labor pool anticipated to put pressure on labor rates) • Cuts in non-public service effecting cost allocation (reductions in MATP trips due to budget constraints); Monroe Twp reverting to University program only • State radio system • Loss of Communications Infrastructure • Cost of Equipment when system changes are required • Costs of technology dependence
Previously Undertaken • Health Care Employee Co-Pay increased from 2.2 to 5% • Reduced earned sick days • Reduced paid holidays • Participation in SAFTI • P&L and Workers Compensation • Dividends returned and recognized as revenue • Cost of Living Adjustments limited to 2% • Travel Restrictions/Limitations
Cost Saving Considerations • Participation in Commonwealth’s Health Insurance • This has the potential to save considerable expense due to the buying power of the Commonwealth. There is no way for the transit health care pool to approach the premium levels of the Commonwealth’s options. • SAFTI Health Insurance Pool • Does not save on premiums initially but anticipated to limit health insurance cost increases to 3.5% annually rather than 9% (current SAFTI member increases)
Fixed Route Service Statistics/Trends: • Describe Any Proposed Changes