Download
1 / 30
300 likes | 397 Views
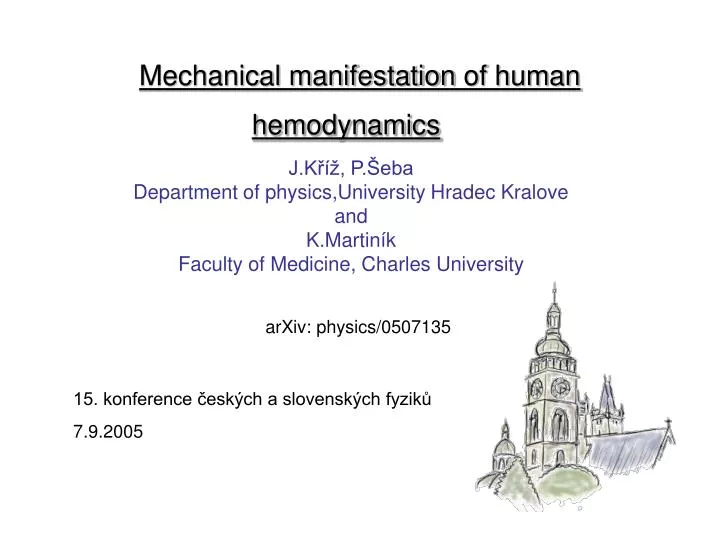
Mechanical manifestation of human hemodynamics. J.Kříž, P.Šeba Department of physics,University Hradec Kralove and K.Martiník Faculty of Medicine , Charles Un iversity. arXiv: physics/0507135. 15. konference českých a slovenských fyziků 7.9.2005. Force plate.

E N D
Mechanical manifestation of human hemodynamics J.Kříž, P.Šeba Department of physics,University Hradec Kralove and K.Martiník Faculty of Medicine, Charles University arXiv: physics/0507135 15. konference českých a slovenských fyziků 7.9.2005
Force plate Measured are the three force and three moment components , i.e. a six dimensional multivariate time series
Force plate Measured are the three force and three moment components , i.e. a six dimensional multivariate time series only five independent channels Usual choice: three force components + point of application of the force: COP
Measurements Using the force plate and a special bed we measured the force plate output and the ECG signal on 17 healthy adult males. In three cases we measured also the heart sounds. In such a way we obtained a 7 or 8 dimensional time series. The used sampling rate was 1000 Hz.
For a reclining subject the motion of the internal masses within the body has a crucial effect. Measured ground reaction forces contain information on the blood mass transient flow at each heartbeat and on the movement of the heart itself. (There are also other sources of the internal mass motion that cannot be suppressed, like the stomach activity etc, but they are much slower and do not display a periodic-like pattern.) Starting point of the cardiac cycle: the R wave of the ECG signal. Length of the cycle: 1000 ms
Multivariate signal: process multidimensional time-parameterized curve. Measured channel: projection of the curve to a given axis Changing the position of an electrode within EEG measurement changes the measured voltage. The measured process remains unchanged. Characterizing the curve: geometrical invariants: c: [a,b]n… Cn([a,b]) – mapping, such that examples of geometrical invariants: length of a curve Curvatures
Frenet frame A Frenet frame is a moving reference frame of northonormal vectors e_i(t) which are used to describe a curve locally at each point γ(t). The main message of the differential geometry: it is more natural to describe local properties of the curve in terms of a local reference system than using a global one like the euclidean coordinates.
Assume that are linearly independent • The Frenet Frame is the family of orthonormal vectors • called Frenet vectors. They are constructed from the derivates of c(t) using the Gram-Schmidt orthogonalization algorithm with • The real valued functions are called generalized curvatures and are defined as
Special cases 2 – dimensional curve …tangent, normal …curvature 3 – dimensional curve …curvature …torsion
Frenet-Serret Formulas Relation between the local reference frame and its changes Curvatures are invariant under reparametrization and Eucleidian transformations! Therefore they are geometric properties of the curve. Main theorem of curve theory
The 5 curvatures were evaluated at each cycle and the mean over cycles was taken. The measurement lasted 8 minutes
What does it mean? Are the curvature peaks linked to some physiological events?
On branching places of large arteries the pulse wave is scattered and the subsequent elastic recoil contribute to the force changes measured by the plate. A similar recoil is expected also when the artery changes its direction (like for instance in the aortal arc).
volunteer pacient
Scattering of the pressure wave on the artery branchings / bendings leads to forces and moments measured by the force plate. Pressure wave velocity: Depends on the elasticity of the arterial wall and on the arterial pressure.
Pulse wave velocity on large arteries is not directly accessible.
Timing and consistency Pulse wave velocity: c=L/T; L=0.7 m
What is it good for? • Measuring the pressure wave velocity in large arteries • Observing pathological reflections (recoils) • Testing the effect of medicaments on the aortal wall properties • etc. and all this fully noninvasively. Cooperation of the patient is not needed