Hemodynamics:
Hemodynamics:. A Clinical Summary Bradley J. Phillips, M.D. Burn-Trauma-ICU Adults & Pediatrics. Cardiac Physiology. “ cardiovascular management should optimize myocardial performance and tissue perfusion at the lowest possible energy cost”

Hemodynamics:
E N D
Presentation Transcript
Hemodynamics: A Clinical Summary Bradley J. Phillips, M.D. Burn-Trauma-ICU Adults & Pediatrics
Cardiac Physiology “ cardiovascular management should optimize myocardial performance and tissue perfusion at the lowest possible energy cost” 1. Cardiac Anatomy 2. Circulatory Pathways
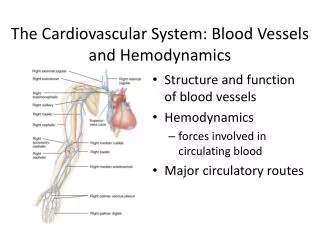
Cardiac Anatomy (1) The Heart: 2 Separate Volume Pumps ! • RA & RV - Low Pressure “Bellows” • LA & LV - High Pressure “Drive” the in-series nature of these two systems implies that the output of the Right Heart becomes the input of the Left Heart, and therefore, the output of the Left Heart becomes the input of the Right Heart 1. Flow via Series 2. Demonstrated by William Harvey, 1628
Cardiac Anatomy (2) • The Heart is a muscular organ enclosed in a fibrous sac, the Pericardium Located within the Mediastinum of the Thoracic Cavity. • Cardiac Muscle is termed the Myocardium • The inner surface of the myocardium (the one in contact with the blood) is lined by a thin layer of Endothelium
Cardiac Anatomy (3) • The Heart is divided into Right & Left Halves • Each consisting of an atrium & ventricle • Separated by the Atrioventricular Valves: Tricuspid Mitral • Openings of the RV into the Pulmonary Trunk • & the LV into the Aorta are also regulated: Pulmonic Aortic 1. Valve Function is a Passive Process ! 2. Function of Papillary Muscles
Circulation (1) Desaturated Blood returns from the Systemic Vessels via the SVC & IVC • Is displaced passively (and actively with atrial contraction) through the Tricuspid Valve - into the Right Ventricle. • Contraction of the RV ejects this volume through the Pulmonic Valve and into the Low-Pressure Pulmonary Artery, (PAP 5 - 12) then through the associated end-capillaries where gas-exchange occurs !
Circulation (2) Saturated Blood is then returned to the Left Atrium via the Pulmonary Veins ! • In the LA, the blood is displaced to the LV (15 - 20 % Atrial “Kick”) • With LV Contraction, blood is forced through the aortic valve into the high-pressure aorta (SBP 120 - 160) thus perfusing the brain, kidneys, abdominal viscera, and extremities
Myocardial Blood Flow (1) Myocardial Perfusion occurs primarily during Diastole ! 1. Flow is provided by the Right & Left Coronary Arteries which are the first branches of the aorta, arising from the Sinuses of Valsalva 2. RCA - supplies the RV Wall, Sinus Node, and AV Node in 90 % of pts, the RCA terminates as the Posterior Descending Artery (Right Coronary Dominance)
Myocardial Blood Flow (2) 3. The Left Main Coronary gives rise to both LAD & Circumflex 4. The LAD is usually the largest of all coronary arteries and supplies the anterior / apical LV, the majority of the IV Septum, and the left side of the RV 5. The Circumflex supplies the lateral LV and in 10 % of pts provides the Posterior Descending Coronary (Left Coronary Dominance)
Myocardial Blood Flow (3) Venous Drainage of the Heart * Occurs mainly via the Coronary Sinus (into the RA). Anterior Cardiac Veins also: Thebesian Channels Sinusoidal Paths ! Total Coronary Flow: 0.7 - 0.9 ml/min/g myocardium
Myocyte Contraction (1) Chemical Mechanical Energy Energy (Oxygen & Substrate) (Pressure & Flow) at the cellular level, electrical depolarization of the myocardial cell membrane allows ionized calcium flux into the cytoplasm - leading to hydrolysis of ATP by Myosin
Myocyte Contraction (2) this leads to a conformational change in the Actin-Myosin Cross Bridge producing sliding of myosin filaments relative to actin & overall shortening of the sarcomere [Sliding Filament Theory] * Calcium is then removed from the cell by Active Transport in the Sarcoplasmic Reticulum - allowing Relaxation, while ATP is regenerated by Metabolic Processes
Myocyte Contraction (3) Over the physiologic range of sarcomere length (1.6 - 2.0 um), the amount of metabolic energy converted to mechanical work is dependent on the available Surface Area of Cross-Bridge Interactions ! * Work is directly proportional to End-Diastolic Sarcomere Length This “Length Dependency” is the fundamental basis for the Frank-Starling Law !
The Frank - Starling Law (1) • Otto Frank, 1885 (Frog Heart Preparations) “the output of a normal heart is influenced primarily by the volume of blood in the ventricle at the end of diastole” • Ernest Starling, 1914 extended this basic principle to mammalian hearts
Frank - Starling (2) • Relationship: EDV to SP • The Steep Ascending Portion of the Curve ! • this area indicates the importance ofPreLoad (i.e. Volume) for augmenting Output • The “Descending Limb” • As EDV becomes Excessive, Pressure begins to Fall • WHY ? • Is it Clinically Significant ?
The Cardiac Output CO = HR x SV “the amount of blood pumped by the heart per unit time” Normal C.O. : 3.5 - 8.5 L/min Manipulation of the factors can lead to augmentation of CO at the lowest possible energy cost !
Cardiac Mechanics (1) Determinants of Cardiac Performance & Output Preload: EDV (the load that stretches a muscle prior to contraction) Afterload: SVR (the load that must be moved during muscle contraction) Contractility:the velocity of muscle shortening at a constant preload and afterload Compliance:the length that a muscle is stretched by a given preload * Determined by the inherent Elasticity ! Heart Rate: several effects on overall cardiac function* Tachycardia/Bradycardia
Mechanics: Preload (2) • At the cellular level, Preload is defined as end-diastolic sarcomere length which is linearly related to EDV. • Problem: We can not measure Ventricular Volume in the Clinical Setting (rather impractical !) • LVEDP represents the Distending Pressure (the Filling Pressure) of the Ventricle and can be used as an index of EDV • However, this Relationship is Exponential, NOT Linear ! • In Normal Hearts, LA Pressure correlates with LV Pressure and thus, becomes the closest approximation of Preload
Mechanics: Preload (3) • Can Measure LA Pressure by using a Left Atrial Catheter ! but tubes are tubes, and series are series !! • In Clinical Practice, can measure Pulmonary Capillary Wedge Pressure as an index of LAP & LVEDP • PCWP = LAP = LVEDP(best approximation) • But Remember, the relationship between LVEDP & LVEDV is NOT Linear !! • So, PCWP is by definition an ESTIMATE of EDV& thus, an ESTIMATE of Preload
Mechanics: Preload (4) • At Filling Pressures of 15 - 18 mm Hg (PCWP), the ventricle operates on the very steep portion of the Diastolic Compliance Curve where further increases in PCWP lead to little change in EDV (and CO) • Issues:Hyperdynamic Resuscitation Potential Injury / Relative Ischemia • Also, the Relationship between PCWP & EDV is NOT Constant ! • It is Affected by Changes in Compliance, Wall Thickness, HR, Ischemia, & Medications • This is a “One-Point-in-Time” Effect
Mechanics: Preload (5) • Right-sided Filling Pressure: CVP • has been used as a rough estimate of LV Preload, but it may be an unreliable indicator of ventricular function (especially in the critically ill patient) • can be used to guide Volume Status • i.e. what is returning to the right atrium/right ventricle ? • may also be useful in patients with suspected cardiac tamponade or constrictive pericarditis * Elevation of CVP to Equal PAD& PCWP * Square Root Sign : characteristic RA waveform in patients with Constrictive Pericarditis
Mechanics: Afterload (6) the impedance to LV Ejection and is usually estimated by the Systemic Vascular Resistance changes in afterload have no effect on the contractility of a normal heart
Mechanics: Afterload (7) • The Normal Heart • SW performed at a given EDV is Insensitive to changes in SVR • The Impaired Heart • Increasing afterload MAY decrease SW output for a given EDV, and thus impair myocardial performance when faced with this situation, if you reduce LV Impedance you may be able to increase CO ! * Sodium Nitroprusside * Intra-Aortic Balloon Pump
Mechanics: Afterload (8) Decreasing Afterload exchanges Pressure Work for Flow Work and serves to increase vital organ perfusion ! Pressure WorkFlow Work plus, since pressure work is more costly than flow work in terms of myocardial oxygen consumption, by decreasing afterload - you also decrease the overall energy requirement !
Mechanics: Afterload (9) Remember: 1. Preload must be Optimized PRIOR to Afterload Reduction 2. A Low Arterial Pressure may preclude SVR Manipulation 3. RV Afterload = PVR * only a massive change in PVR can induce primary heart dysfunction !! * the vast majority of RV Failure is Secondary to LVF and usually responds to measures directed at the LV * Isolated RVF : Massive PE, Severe COPD (post-op), Isolated RV Infarct
Mechanics: Contractility (10) the inotropic state an intrinsic property of myocardial muscle which is manifested as a greater force of contraction for a given preload. • In terms of pressure & volume, the ventricle performs the same SW for a given EDV when the inotropic state is held constant. 2. When the inotropic state is augmented, more SW is produced at the same EDV.
Mechanics: Contractility (11) Clinically, this translates into an Increased CO & MAP at a given Filling Pressure ! by increasing inotropic state, you increase both Pressure Work & Flow Work, thus, increasing myocardial oxygen consumption…
Mechanics: Contractility (12) • An increased inotropic state may lead to a delay in recovery of function following myocardial injury ! • Inotropic Agents should only be used with caution & only AFTER other factors have been optimized !! * Preload * Afterload * Heart Rate
Mechanics: Compliance (13) “Elasticity” the tendency of an object to return to it’s original shape when it has been deformed or altered 1. The more elastic the muscle, the less it will be stretched by preload (i.e. the less compliant it is) 2. Elasticity is the Reciprocal of Compliance !
Mechanics: Heart Rate (14) Heart Rate can Influence Cardiac Function in Several Ways: 1. Increasing the Contraction Frequency limits Diastolic Filling Time, Coronary Perfusion Time, & Reduces overall EDV 2. Increasing Rate increases Work Output from the ventricle per unit time at a given EDV. [An Inotropic Effect] 3. Increasing Rate increases Myocardial O2 Consumption 4. Bradycardia significantly decreases CO
Basic Hemodynamics Cardiac Physiology is based on a thorough understanding of the underlying mechanics ! 1. Anatomy & Circulation 2. Flow & Perfusion 3. Myocyte Contraction 4. The Frank-Starling Curve 5. Cardiac Output & the Determinant Factors
Hemodynamics: Case 1 65 yr. old female 6 hrs. after right hemicolectomy… nurses call with “no urine output over last 2 hrs.” • Working Diagnosis • Clinical Approach • Interventions • Findings, Results, & Treatment
Hemodynamics: Case 1 65 yr. old female 6 hrs. after right hemicolectomy… nurses call with “no urine output over last 2 hrs.” • Pulse 76 • MAP 55 • SaO2 88 % • ABG’s 7.30, 28, 65, 21, 86%
Hemodynamics: Case 1 65 yr. old female 6 hrs. after right hemicolectomy… nurses call with “no urine output over last 2 hrs. • Fluid bolus given…. • No response • Pt looking worse • Nurses ask: “are you a real doctor ?”
Hemodynamics: Case 1 65 yr. old female 6 hrs. after right hemicolectomy… nurses call with “no urine output over last 2 hrs.” • CVP 6 • PWP 11 • CO 3.6 • CI 2.2 • SVR 1760
Hemodynamics: Case 1 65 yr. old female 6 hrs. after right hemicolectomy… nurses call with “no urine output over last 2 hrs.” • CVP 10 MAP 68 • PWP 14 UO “scant” • CO 4.2 now what are • CI 2.5 you going to do ? • SVR 1420
Hemodynamics: Case 1 65 yr. old female 6 hrs. after right hemicolectomy… nurses call with “no urine output over last 2 hrs.” • CVP 12 MAP 89 • PWP 16 UO “picking up” • CO 5.2 now what are • CI 3.1 you going to do ? • SVR 1135
Hemodynamics: Case 1 65 yr. old female 6 hrs. after right hemicolectomy… nurses call with “no urine output over last 2 hrs.” • CVP 17 • PWP 22 • CO 4.0 now what are • CI 2.6 you going to do ? • SVR 1708
Hemodynamics: Case 1 65 yr. old female 6 hrs. after right hemicolectomy. nurses notice EKG Changes on the monitor… Dropping pressures….
Hemodynamics: Case 1 65 yr. old female 6 hrs. after right hemicolectomy. nurses notice EKG Changes on the monitor… Pressure’s 40/palp….
Hemodynamics: Case 1 65 yr. old female 6 hrs. after right hemicolectomy. nurses notice EKG Changes on the monitor… Sat’s going down…..
Hemodynamics: Case 1 65 yr. old female 6 hrs. after right hemicolectomy. nurses notice EKG Changes on the monitor… “I can’t feel a pulse…”
Hemodynamics: Case 2 52 yr. old male 4 days after admission following MVC… nurses call:“this guy just doesn’t look good – he’s fighting the vent, tachycardic, and spiked a temp to 103.” • Working Diagnosis • Clinical Approach • Interventions • Findings, Results, & Treatment
Hemodynamics: Case 2 52 yr. old male 4 days after admission following MVC… nurses call: “this guy just doesn’t look good – he’s fighting the vent, tachycardic, and just spiked a temp to 103.” A, B, C’s…
Hemodynamics: Case 2 52 yr. old male 4 days after admission following MVC… nurses call with “this guy just doesn’t look good – he’s fighting the vent, tachycardic, and just spiked a temp to 103.” • Pulse 114 • MAP 65 • SaO2 91 % • ABG’s 7.29, 31, 90, 21, 90%
Hemodynamics: Case 2 52 yr. old male 4 days after admission following MVC… nurses call with “this guy just doesn’t look good – he’s fighting the vent, tachycardic, and just spiked a temp to 103.” • CVP 12 • PWP 18 • CO 5.2 now what are • CI 3.4 you going to do ? • SVR 660
Hemodynamics: Case 2 52 yr. old male 4 days after admission following MVC… nurses call with “this guy just doesn’t look good – he’s fighting the vent, tachycardic, and just spiked a temp to 103.” • CVP 14 • PWP 22 • CO 5.9 • CI 3.2 • SVR 890
Questions & Clinical Scenarios • “Swan won’t wedge…” • “Balloon won’t deflate” • “What trend…oh, you wanted us to shoot more numbers ?” • “What do you do with all those numbers anyways ?” • “Bright red bleeding from the ET tube after balloon inflated”