Graph Classification
Graph Classification. Classification Outline. Introduction, Overview Classification using Graphs Graph classification – Direct Product Kernel Predictive Toxicology example dataset Vertex classification – Laplacian Kernel WEBKB example dataset Related Works. Example: Molecular Structures.

Graph Classification
E N D
Presentation Transcript
Classification Outline • Introduction, Overview • Classification using Graphs • Graph classification – Direct Product Kernel • Predictive Toxicology example dataset • Vertex classification – Laplacian Kernel • WEBKB example dataset • Related Works
Example: Molecular Structures Unknown Known A Toxic Non-toxic B E D B A C C A E B D B D C C A E Task: predict whether molecules are toxic, given set of known examples D F
Solution: Machine Learning • Computationally discover and/or predict properties of interest of a set of data • Two Flavors: • Unsupervised: discover discriminating properties among groups of data (Example: Clustering) • Supervised: known properties, categorize data with unknown properties (Example: Classification)
Classification • Classification: The task of assigning class labels in a discrete class label set Y to input instances in an input space X • Ex: Y = { toxic, non-toxic }, X = {valid molecular structures} Misclassified datainstance (test error) Unclassified datainstances Assignment of theunknown (test) data to appropriate class labelsusing the model Training the classification model using the training data
Classification Outline • Introduction, Overview • Classification using Graphs, • Graph classification – Direct Product Kernel • Predictive Toxicology example dataset • Vertex classification – Laplacian Kernel • WEBKB example dataset • Related Works
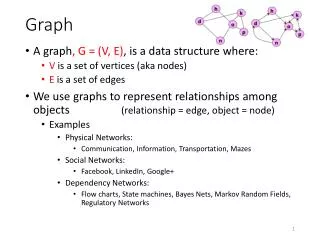
Classification with Graph Structures • Graph classification (between-graph) • Each full graph is assigned a class label • Example: Molecular graphs • Vertex classification (within-graph) • Within a single graph, each vertex is assigned a class label • Example: Webpage (vertex) / hyperlink (edge) graphs A B E D NCSU domain Faculty C Toxic Course Student
Relating Graph Structures to Classes? • Frequent Subgraph Mining (Chapter 7) • Associate frequently occurring subgraphs with classes • Anomaly Detection (Chapter 11) • Associate anomalous graph features with classes • *Kernel-based methods (Chapter 4) • Devise kernel function capturing graph similarity, use vector-based classification via the kernel trick
Relating Graph Structures to Classes? • This chapter focuses on kernel-based classification. • Two step process: • Devise kernel that captures property of interest • Apply kernelizedclassification algorithm, using the kernel function. • Two type of graph classification looked at • Classification of Graphs • Direct Product Kernel • Classification of Vertices • Laplacian Kernel • See Supplemental slides for support vector machines (SVM), one of the more well-known kernelized classification techniques.
Walk-based similarity (Kernels Chapter) • Intuition – two graphs are similar if they exhibit similar patterns when performing random walks H I J Random walk vertices heavily distributed towards A,B,D,E Random walk vertices heavily distributed towards H,I,K with slight bias towards L Similar! A B C K L Q R S D E F Random walk vertices evenly distributed Not Similar! T U V
Classification Outline • Introduction, Overview • Classification using Graphs • Graph classification – Direct Product Kernel • Predictive Toxicology example dataset. • Vertex classification – Laplacian Kernel • WEBKB example dataset. • Related Works
Direct Product Graph – Formal Definition Input Graphs Direct Product Vertices Direct Product Notation Direct Product Edges Intuition Vertex set: each vertex of paired with every vertex of Edge set: Edges exist only if both pairs of vertices in the respective graphs contain an edge
Direct Product Graph - example B A C A E B D D C Type-A Type-B
Direct Product GraphExample Type-A A B C D 0 0 0 0 0 0 1 1 1 1 0 1 1 1 1 0 0 0 0 0 0 0 0 0 0 1 0 0 0 0 1 0 0 0 0 0 0 0 0 0 0 0 0 0 0 1 0 0 0 01 0 0 0 0 0 0 0 0 0 0 0 0 0 0 1 0 0 0 0 1 0 0 0 0 0 0 0 0 0 0 0 0 0 0 1 0 0 0 0 1 0 0 0 0 0 0 0 0 0 0 1 1 1 1 0 0 0 0 0 0 0 0 0 0 0 1 1 1 1 1 0 0 0 0 0 0 0 0 0 0 0 0 0 0 1 0 0 0 0 1 0 0 0 0 0 0 0 0 0 0 0 0 0 0 1 0 0 0 0 1 0 0 0 0 0 0 0 0 0 0 0 0 0 0 1 0 0 0 0 1 0 0 0 0 0 0 0 0 0 0 0 0 0 0 1 0 0 0 0 0 1 1 1 1 0 0 0 0 0 0 0 0 0 0 0 1 1 1 1 1 0 0 0 0 0 0 0 0 0 0 0 0 0 0 1 0 0 0 0 1 0 0 0 0 0 0 0 0 0 0 0 0 0 0 1 0 0 0 0 1 0 0 0 0 0 0 0 0 0 0 0 0 0 0 1 0 0 0 0 1 0 0 0 0 0 0 0 0 0 0 0 0 0 0 1 0 0 0 0 0 0 0 0 0 0 1 1 1 1 0 1 1 1 1 0 0 0 0 0 0 0 0 0 0 1 0 0 0 0 1 0 0 0 0 0 0 0 0 0 0 0 0 0 0 1 0 0 0 0 1 0 0 0 0 0 0 0 0 0 0 0 0 0 0 1 0 0 0 0 1 0 0 0 0 0 0 0 0 0 0 0 0 0 0 1 0 0 0 0 1 0 0 0 0 0 0 0 0 0 Type-B A B C D E A B C D E A B C D E A B C D E A B C D E A B C D E A B C D E A B C D E A B C D Intuition: multiply each entry of Type-A by entire matrix of Type-B
Direct Product Kernel (see Kernel Chapter) • Compute direct product graph • Compute the maximum in- and out-degrees of Gx, di and do. • Compute the decay constant γ < 1 / min(di, do) • Compute the infinite weighted geometric series of walks (array A). • Sum over all vertex pairs. Direct Product Graph of Type-A and Type-B
Kernel Matrix • Compute direct product kernel for all pairs of graphs in the set of known examples. • This matrix is used as input to SVM function to create the classification model. • *** Or any other kernelized data mining method!!!
Classification Outline • Introduction, Overview • Classification using Graphs, • Graph classification – Direct Product Kernel • Predictive Toxicology example dataset. • Vertex classification – Laplacian Kernel • WEBKB example dataset. • Related Works
Predictive Toxicology (PTC) dataset • The PTC dataset is a collection of molecules that have been tested positive or negative for toxicity. A B D # R code to create the SVM model data(“PTCData”) # graph data data(“PTCLabels”) # toxicity information # select 5 molecules to build model on sTrain = sample(1:length(PTCData),5) PTCDataSmall <- PTCData[sTrain] PTCLabelsSmall <- PTCLabels[sTrain] # generate kernel matrix K = generateKernelMatrix (PTCDataSmall, PTCDataSmall) # create SVM model model =ksvm(K, PTCLabelsSmall, kernel=‘matrix’) C B C A E D
Classification Outline • Introduction, Overview • Classification using Graphs, • Graph classification – Direct Product Kernel • Predictive Toxicology example dataset. • Vertex classification – Laplacian Kernel • WEBKB example dataset. • Related Works
Kernels for Vertex Classification • von Neumann kernel • (Chapter 6) • Regularized Laplacian • (This chapter)
Example: Hypergraphs • A hypergraphis a generalization of a graph, where an edge can connect any number of vertices • I.e., each edge is a subset of the vertex set. • Example: word-webpage graph • Vertex – webpage • Edge – set of pages containing same word
“Flattening” a Hypergraph • Given hypergraph matrix , represents “similarity matrix” • Rows, columns represent vertices • entry – number of hyperedges incident on both vertex and . • Problem: some neighborhood info. lost (vertex 1 and 3 just as “similar” as 1 and 2)
Laplacian Matrix • In the mathematical field of graph theory the Laplacian matrix (L), is a matrix representation of a graph. • L = D – M • M – adjacency matrix of graph (e.g., A*AT from hypergraph flattening) • D – degree matrix (diagonal matrix where each (i,i) entry is vertex i‘s [weighted] degree) • Laplacian used in many contexts (e.g., spectral graph theory)
Normalized Laplacian Matrix • Normalizing the matrix helps eliminate bias in matrix toward high-degree vertices if and if and is adjacent to otherwise Original L Regularized L
Laplacian Kernel • Uses walk-based geometric series, only applied to regularized Laplacian matrix • Decay constant NOT degree-based – instead tunable parameter < 1 Regularized L
Classification Outline • Introduction, Overview • Classification using Graphs, • Graph classification – Direct Product Kernel • Predictive Toxicology example dataset. • Vertex classification – Laplacian Kernel • WEBKB example dataset. • Related Works
WEBKB dataset word 2 • The WEBKB dataset is a collection of web pages that include samples from four universities website. • The web pages are assigned into five distinct classes according to their contents namely course, faculty, student, project and staff. • The web pages are searched for the most commonly used words. There are 1073 words that are encountered at least with a frequency of 10. word 4 word 1 word 3 # R code to create the SVM model data(WEBKB) # generate kernel matrix K = generateKernelMatrixWithinGraph(WEBKB) # create sample set for testing holdout <- sample (1:ncol(K), 20) # create SVM model model =ksvm(K[-holdout,-holdout], y, kernel=‘matrix’)
Classification Outline • Introduction, Overview • Classification using Graphs, • Graph classification – Direct Product Kernel • Predictive Toxicology example dataset. • Vertex classification – Laplacian Kernel • WEBKB example dataset. • Kernel-based vector classification – Support Vector Machines • Related Works
Related Work – Classification on Graphs • Graph mining chapters: • Frequent Subgraph Mining (Ch. 7) • Anomaly Detection (Ch. 11) • Kernel chapter (Ch. 4) – discusses in detail alternatives to the direct product and other “walk-based” kernels. • gBoost – extension of “boosting” for graphs • Progressively collects “informative” frequent patterns to use as features for classification / regression. • Also considered a frequent subgraph mining technique (similar to gSpan in Frequent Subgraph Chapter). • Tree kernels – similarity of graphs that are trees.
Related Work – Traditional Classification • Decision Trees • Classification model tree of conditionals on variables, where leaves represent class labels • Input space is typically a set of discrete variables • Bayesian belief networks • Produces directed acyclic graph structure using Bayesian inference to generate edges. • Each vertex (a variable/class) associated with a probability table indicating likelihood of event or value occurring, given the value of the determined dependent variables. • Support Vector Machines • Traditionally used in classification of real-valued vector data. • See Kernels chapter for kernel functions working on vectors.
Related Work – Ensemble Classification • Ensemble learning: algorithms that build multiple models to enhance stability and reduce selection bias. • Some examples: • Bagging: Generate multiple models using samples of input set (with replacement), evaluate by averaging / voting with the models. • Boosting: Generate multiple weak models, weight evaluation by some measure of model accuracy.
Related Work – Evaluating, Comparing Classifiers • This is the subject of Chapter 12, Performance Metrics • A very brief, “typical” classification workflow: • Partition data into training, test sets. • Build classification model using only the training set. • Evaluate accuracy of model using only the test set. • Modifications to the basic workflow: • Multiple rounds of training, testing (cross-validation) • Multiple classification models built (bagging, boosting) • More sophisticated sampling (all)
Related Work – Evaluating, Comparing Classifiers • This is the subject of Chapter 12, Performance Metrics • A very brief, “typical” classification workflow: • Partition data into training, test sets. • Build classification model using only the training set. • Evaluate accuracy of model using only the test set. • Modifications to the basic workflow: • Multiple rounds of training, testing (cross-validation) • Multiple classification models built (bagging, boosting) • More sophisticated sampling (all)