Download
1 / 12
120 likes | 263 Views
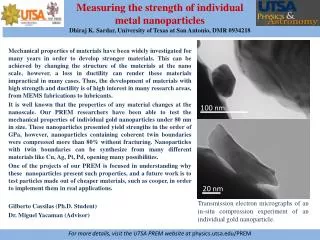
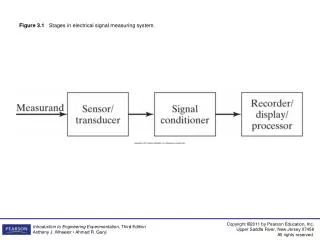
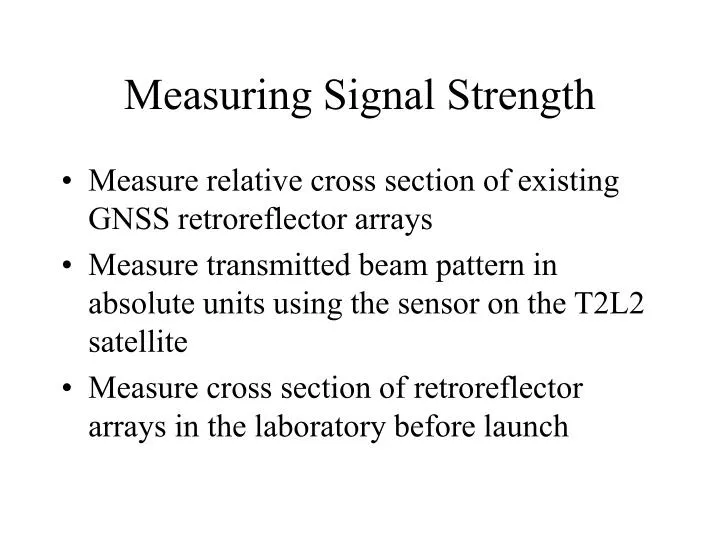
Measuring Signal Strength. Measure relative cross section of existing GNSS retroreflector arrays Measure transmitted beam pattern in absolute units using the sensor on the T2L2 satellite Measure cross section of retroreflector arrays in the laboratory before launch.

E N D
Measuring Signal Strength • Measure relative cross section of existing GNSS retroreflector arrays • Measure transmitted beam pattern in absolute units using the sensor on the T2L2 satellite • Measure cross section of retroreflector arrays in the laboratory before launch
Why measure signal strength? • High altitude GNSS satellites require very high cross section. Present arrays give weak signals • Uncoated cubes appear to give higher cross section than coated cubes. • ETS-8 uses uncoated cubes but can only be observed from Asian stations. COMPASS uses uncoated cubes and gives global visibility • Quantitative signal strength measurements would be helpful for designing future GNSS arrays.
Relative signal strength • It is not possible to measure absolute signal strength because of various uncertainties. • Relative signal strength can be measured relatively accurately • The variation of signal strength with range can be accurately computed • Uncertainties in atmospheric models cancel if observations are made at the same zenith angle
Method of analysis • Correct observations to a standard range such as 20 megameters • Do a semi-log plot of signal strength for each satellite and station vs zenith angle • There should be a constant difference (ratio) between the plots for different satellites.
Experiment plan • Range to COMPASS, GLONASS, GPS, Giove-A, Giove-B using same system set up • Range as often as possible for a few minutes per satellite at a variety of zenith angle • Make estimates of relative return rates if possible • Deposit full-rate and NP data
T2L2 experiment • Calculated and measured signal strengths can differ by an order of magnitude • The sensor on T2L2 can measure the signal received at the satellite • Measuring the signal strength at the satellite can help determine whether the discrepancies between measured and calculated signal strength are on the uplink or the downlink
Beam pattern • Scanning the transmitted beam across the T2L2 satellite can be used to map the transmitted beam pattern • The central part of the beam pattern may not contain the total energy due to large angle scattering. • Measuring the absolute signal received at the satellite can determine the signal lost to atmospheric absorption or large angle scattering.
Variations in transmitted beam • Measurements of the beam pattern received at the T2L2 satellite can be used to study the received energy and beam divergence as a function of: • Atmospheric conditions • Zenith angle • Station parameters • Beam divergence is limited by seeing conditions. Variations in seeing conditions can change the beam divergence and signal strength. Narrow beams may be most sensitive to seeing conditions.
Positive and negative dihedral angle offsets in uncoated cubes • A dihedral angle offset in an uncoated cube produces an asymmetrical diffraction pattern when linear polarization is used. • An equal mixture of positive and negative offsets eliminates the polarization asymmetry. • A thermal study suggests that an equal mixture of positive and negative offsets is more stable. • Specification of 0.0 +/- .5 arcsec gives angles from -.5 to +.5 arcsec. Specification of .75 +/- .5 arcsec gives angles from .25 to 1.25 arcsec.
No dihedral angle offset Plotted with .24 maximum Uncoated, circular polarization Coated 1.5 inch No dihedral offset Plotted with .93 max Scale -50 to +50 µrad Same as above with .12 maximum (All plots below are .12 max) +.75 arcsec dihedral offset -.75 arcsec dihedral offset Average of +.75 and -.75 No offset Circular Linear Linear Linear Linear
Analysis and testing of uncoated cube corners • During the APOLLO program analytical calculations and laboratory tests were done. • Analytical programs were developed at SAO in 1971 for the LAGEOS mission. • LNF in Italy has thermal vacuum laboratory facilities, thermal modeling program, and optical ray tracing program using CodeV. • Reinhart Neubert measured an uncoated cube. • Optical ray tracing program recently developed by Toshimichi Otsubo.
LNF Space Climactic FacilitySimone Dell’Agnello • Spare GPS array (flight qualified) • Section of LAGEOS cubes • LARES cubes and whole array • Russian prototype cube corners • Proposed LUNAR cube • NASA hollow cube • Maintain facility for testing future arrays?