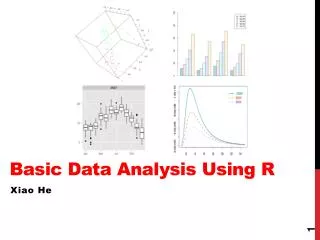
Basic Data Analysis III
Basic Data Analysis III. SPSS Training Thomas V. Joshua , MS July , 2012. College of Nursing. Lecture Overview. Correlation Linear Regression One-way ANOVA General Linear Model (GLM). Correlation.

Basic Data Analysis III
E N D
Presentation Transcript
Basic Data Analysis III SPSS Training Thomas V. Joshua, MS July , 2012 College of Nursing
Lecture Overview • Correlation • Linear Regression • One-way ANOVA • General Linear Model (GLM)
Correlation • Correlation is one of the most common forms of data analysis because it underlies many other analyses. • A correlation coefficient has a value ranging from -1 to 1. Values that are closer to the absolute value of 1 indicate that there is a strong relationship between the variables being correlated, whereas values closer to 0 indicate that there is little or no linear relationship. • The sign of a correlation coefficient describes the type of relationship between the variables being correlated. A positive correlation coefficient indicates that there is a positive linear relationship between the variables: as one variable increases in value, so does the other.
Correlation • Prior to conducting a correlation analysis, it is advisable to plot the two variables to visually inspect the relationship between them. Graphs-> Legacy Dialogs ->Scatter/Dot
Correlation • This plot indicates that there is a positive, fairly linear relationship between current salary and education level. In order to test whether this apparent relationship is statistically significant, we could run a correlation. • To obtain a correlation in SPSS, Analyze -> Correlate -> Bivariate
Correlation • The first option to consider is the type of correlation coefficient. Pearson's is appropriate for continuous data, whereas the other two correlation coefficients, Kendall's tau-b and Spearman's, are designed for ranked data.
Note that despite there being nine cells in the above matrix, there are only three correlation coefficients of interest: (1) the correlation between current salary and educational level, (2) the correlation between previous experience and educational level, and (3) the correlation between current salary and previous experience.
Regression • Regression is a technique that can be used to investigate the effect of one or more predictor variables on an outcome variable. • For example, if you were interested in investigating which variables in the employee database were good predictors of employees' current salaries, you could create a regression equation that would use several of the variables in the dataset to predict employees' salaries. • By doing this you will be able to make statements about whether variables such as employees' number of years of education, their starting salary, or their number of months on the job are good predictors of their current salaries.
Regression • To conduct a regression analysis, Analyze -> Regression -> Linear • Employees' current salary has been entered as the dependent variable. In the Independent(s) box, four predictor variables have been entered: educational level, previous experience, beginning salary, and months since hire. • The box labeled Method allows you to select from one of five methods: Enter, Remove, Forward, Backward, and Stepwise. • In this example, we will use the SPSS default method, Enter, which is a standard approach in regression models.
Regression – Annotated Output 1. Variables in the model • If we did not block the independent variables or use stepwise regression, the Variables Entered column should list all of the independent variable that you specified. • In this example, we will use the SPSS default method, Enter, which means that each independent variable was entered in usual fashion.
2. Overall model fit • R is the correlation between the observed and predicted values of dependent variable. • R-Square is the proportion of variance in the dependent variable which can be predicted from the independent variables. It is overall measure of the strength of association, and does not reflect the extent to which any particular independent variable.
3. ANOVA table • Source of variance - Regression, Residual and Total. The Total variance is partitioned into the variance which can be explained by the independent variables (Regression) and the variance which is not explained by the independent variables (Residual, sometimes called Error). • The p-value associated with this F value is very small (0.0000). These values are used to answer the question "Do the independent variables reliably predict the dependent variable?".
3. Anova table (con’t) • Note that the F-test in ANOVA table is an overall significance test assessing whether the group of independent variables when used together reliably predict the dependent variable, and does not address the ability of any of the particular independent variables to predict the dependent variable. • The ability of each individual independent variable to predict the dependent variable is addressed in the table below where each of the individual variables are listed.
4. Parameter estimates • The first variable (constant) represents the constant, also referred to as the Y intercept, the height of the regression line when it crosses the Y axis. In other words, this is the predicted value of Current Salary when all other variables are 0. • B - These are the values for the regression equation for predicting the dependent variable from the independent variable. • The regression equation can be presented in many different ways, for example: CurrentSalaryPredicted = -16149.7 + 669.9*EducationLevel + 1.77*BeginningSalary - 17.3*PreExperience + 161.5*Months
4. Parameter estimates (con’t) • A well-known problem with the interpretation of unstandardized coefficients is that their values are dependent on the scale of the variable for which they were calculated, which makes it difficult to assess the relative influence of independent variables through a comparison of unstandardized coefficients.
4. Parameter estimates (con’t) • Beta - These are the standardized coefficients or z score form. • t and Sig. - These columns provide the t-value and 2 tailed p-value used in testing the null hypothesis that the coefficient/parameter is 0.
4. Parameter estimates (con’t) • 95% Confidence Limit for B Lower Bound and Upper Bound - This shows a 95% confidence interval for the coefficient. • The confidence intervals are related to the p-values such that the coefficient will not be statistically significant if the confidence interval includes 0. • Such confidence intervals help you to put the estimate from the coefficient into perspective by seeing how much the value could vary.
One-way Analysis of Variance (ANOVA) • To conduct a one-way ANOVA, Analyze -> Compare Means -> One-Way ANOVA LSD - Least-significant difference
One-way Analysis of Variance (ANOVA) • The mean of the dependent variable, Current Salary, differs significantly among the three categories of employee. However, we do not know if the difference is between only two of the categories or all three of the categories.
One-way Analysis of Variance (ANOVA) • Post Hoc Multiple Comparisons (LSD - Least-significant difference)
General Linear Model (GLM) • There are three varieties of the general linear model available in SPSS: univariate, multivariate, and repeated measures. • The univariate general linear model is used in situations where you only have a single dependent variable, but may have several independent variables that can be fixed between-subjects factors, random between-subjects factors, or covariates. • The multivariate general linear model is used in situations where there is more than one dependent variable and independent variables are either fixed between-subjects factors or covariates. • The repeated measures general linear model is used in situations where you have more than one measurement occasion for a dependent variable and have fixed between-subjects factors or covariates as independent variables. We will focus on the univariate version of the general linear model.
General Linear Model (GLM) • To specify a univariate general linear model in SPSS, Analyze -> General Linear Model -> Univariate • This dialog box demonstrates a model with multiple types of independent variables. The variable gender has been designated as a fixed factor because it contains all of the levels of interest.
Covariates are often entered in models to reduce error variance: by removing the effects of the relationship between the covariate and the dependent variable, you can often get a better estimate of the amount of variance that is being accounted for by the factors in the model. • Covariates can also be used to measure the linear association between the covariate and a dependent variable, as is done in regression models.
General Linear Model (GLM) • The default model for the SPSS univariate GLM will include main effects for all independent variables and will provide interaction terms for all possible combinations of fixed and random factors. • You may not want this default model, or you may want to create interaction terms between your covariates and some of the factors.
The homogeneity of regression slopes is assumed that the relationship between the covariate and the dependent variable is the same at all levels of the independent variables. To make changes in the default model, click on the Model button, which will produce the following dialog box: • The first step for modifying the default model is to click on the button labeled Custom, to activate the grayed out areas of the dialog box. At this point, you can begin to move variables in the Factors & Covariates box into the Model box. • To build the interactions, click on the arrow facing downwards in the Build Term(s) section and select interaction, as shown in the figure below.
After you have selected the interaction, you can click on the names of the variables with which you would like to build an interaction, then click on the arrow facing right under the Build Term(s) heading. • Some of the other options in the Build Terms list that you may find useful are the All n-way options. • For example if you highlighted all three variables in the Factors & Covariates box, you could create all of the three possible 2-way interactions by selecting the All 2-way option from the Build Terms(s) drop-down menu, then clicking the right-facing arrow.
Examining the group by covariate effects, you can see that both were nonsignificant. The gender*salbegin effect has a small F statistic (.660) and a large significance value (.417), the educ*salbegin effect also has a small F statistic (1.808) and large significance value (.369), and the salbegin*educ effect also has a small F statistic (1.493) and large significance level (.222). • Because all of these significance levels are greater than .05, the homogeneity of regression assumption has been met and you can proceed with the ANCOVA.
The default output for the univariate general linear model contains all main effects and interactions between fixed factors. The below output contains no interactions because gender is the only fixed factor. • To evaluate the influence of each independent variable, look at the F statistic and its associated significance level. Examining the first covariate, education level, the F statistic (37.87) and its associated significance level (.000) indicate that it has a significant linear relationship with the dependent variable. The second covariate, salbegin, also has a significant F statistic (696.12) as can be seen from its associated significance level (.000).
The next source of variance, gender, provides us with a test of the null hypothesis that there are no differences between gender groups (i.e., that there are not differences between men and women's salaries) when education and beginning salary are controlled. • This test provides a small F statistic (3.87) and a significance level that is just barely statistically significant (p = .05). In the above model containing education level and beginning salaries as covariates, we can say that there is a statistically significant difference between men and women's salaries.
To further interpret this effect, go back to the Univariate dialog box and click on the Options button. Choose the variable gender and click it over to the Display Means For box. • This will present the estimated means for each group, taking into account the covariates educational level and beginning salary, as shown next.
Note that after setting both groups equal to the mean educational and beginning salary level, men in this company earn approximately $1,590 more than women in current salary. It is possible that the inclusion of other covariates could explain away the remaining difference between the two groups’ salaries.