Download
1 / 43
430 likes | 644 Views
Air Pollution and Built Environment: How Where You Live Affects Your Health . Francine Laden, ScD Mark and Catherine Winkler Associate Professor of Environmental Epidemiology Harvard School of Public Health Boston MA USA. Overview. The Nurses’ Health Study Air pollution Exposure modeling

E N D
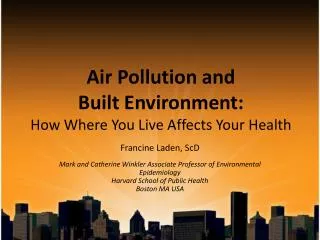
Air Pollution and Built Environment: How Where You Live Affects Your Health Francine Laden, ScD Mark and Catherine Winkler Associate Professor of Environmental Epidemiology Harvard School of Public Health Boston MA USA
Overview • The Nurses’ Health Study • Air pollution • Exposure modeling • Associations with health • The Built Environment • Conceptual model • The county sprawl index • Individual level measures • Summary
The Nurses’ Health Studies • Prospective cohort studies of US women • NHS: 121,700 nurses enrolled in 1976, aged 30-55 • NHSII: 118,000 nurses enrolled in 1989, aged 25-45 • Followed every 2 years by mailed questionnaire • Disease follow-up • Risk factors and exposures
At Baseline… NHS 1976 NHSII 1989
And Now… NHS 1986-2010 NHSII 1989-2009
Spatio-temporal Models • GIS techniques • Complex model including existing monitoring networks, weather, and • GIS covariates including distance to road, elevation, land-use, county level emissions, population density, point source emissions • Monthly average models PM10, PM2.5, PM10-2.5
Distance to Major Road • US Census Road Classifications • A1 (primary roads, typically interstates, with limited access) • A2 (primary major, non-interstate roads) • A3 (smaller, secondary roads, usually with more than two lanes)
Hazardous Air Pollutants (HAPs) • EPA National Air Toxics Assessments • 1990, 1996, 1999, 2002, 2006 • Includes metals, diesel particulate, methylene chloride, quinoline, styrene, trichlorethylene, vinyl chloride • Census tract level estimated concentrations of pollutants from outdoor sources based on dispersion models
All-cause Mortality and PM10Northeastern Region 1992-2004 16% increase per 10 μg/m3↑ in 12-month avg PM10 Adjusted for age, year, season and state of residence Puett et al. AJE 2008: 168:1161–68
Mortality and Coronary Heart Disease – 10 μg/m3↑ Fine and Coarse PM Adjusted for the other size fraction, age, state, year, season, smoking , BMI, risk factors for CHD, physical activity, neighborhood SES. Puett et al. EHP 2009: 117:1697–1701
Effect Modification BMI and SmokingFatal CHD and PM10 Puett et al. AJE 2008: 168:1161–68
Cognitive Decline • PM can access the brain via • Circulation • Intranasal route → direct translocation through olfactory bulb • … where it may precipitate inflammatory response, injure BBB, increase amyloid beta • Associations with CVD, stroke, and vascular risk factors
Cognitive Decline • NHS participants ≥ 70 yrs n= ~17,000 • Cognitive assessment by telephone • Tests of working memory attention, global cognition, verbal memory/learning and verbal fluency • Baseline administered 1995-2001 • 2nd and 3rd approx 2 and 4 yrs later • PM10, PM2.5, PM10-2.5
Long-term exposure to PM10-2.5 in relation to decline in standardized cognitive score Ptrend= 0.01 Difference in global cognitive score change per 2 years, by increasing quintile of PM10-2.5 (ref: lowest quintile) 1 year of age ref Median of PM10-2.5 quintile, μg/m3 Adjusted for age, education, husband's education, smoking history, physical activity, and alcohol consumption. Weuveet al. Arch Intern Med 2012: 172:219-27
Stronger association with measures of long-term exposure to PM10-2.5 Past 5 yrs Since 1989 Difference in global cognitive score change per 2 years, per 10 μg/m3 increase in PM10-2.5 1 year of age Past month Past yr Past 2 yrs Adjusted for age, education, husband's education, smoking history, physical activity, and alcohol consumption.
Long-term exposure to PM2.5 in relation to decline in standardized cognitive score Ptrend= 0.11 Difference in global cognitive score change per 2 years, by increasing quintile of PM2.5 (ref: lowest quintile) 1 year of age Median of PM2.5 quintile, μg/m3 Adjusted for age, education, husband's education, smoking history, physical activity, and alcohol consumption.
Stronger association with measures of long-term exposure to PM2.5 Past 2 yrs Past yr Past 5 yrs Since 1989 Difference in global cognitive score change per 2 years, per 10 μg/m3 increase in PM2.5 1 year of age Past month Adjusted for age, education, husband's education, smoking history, physical activity, and alcohol consumption.
Parkinson’s Disease Adjusted for age, smoking, region population density, caffeine intake and ibuprofen use Palacios et al. in preparation
Diabetes Particulate Matter Distance to Road Adjusted for age, season, year, state, smoking , BMI, hypertension, alcohol intake, physical activity, and diet. Puett et al. 2011 EHP 119: 384-389
Uterine Fibroids Risk for each 10 μg/m3 increase in PM2.5 among 67,487 women in NHSII, 1993-2007; 5,814 cases Adjusted for age, calendar time, race, current BMI, smoking status, parity, OC use, age at menarche, age at first and last birth, time since last birth, total months of exclusive breastfeeding, antihypertensive medication use and blood pressure, and Census tract level median income and median home value Mahalingaiah et al. in preparation
Rheumatoid Arthritis Hart et al. EHP 2009;117: 1065-1069
Autism and HAPS Roberts et al, submitted
The Built Environment: IOM Definition • Land-Use Patterns • Spatial distribution of human activities • Transportation Systems • Physical infrastructure and services that provide the spatial links or connectivity among activities • Design Features • Aesthetic, physical, and functional qualities of the built environment, such as the design of buildings and streetscapes, and relates to both land use patterns and the transportation system
Street connectivity Conceptual model: Effects of the built environment on physical activity and obesity Residential or population density Access to physical activity resources Physical activity environment Access, density, and diversity of destinations Physical activity Obesity Morbidity / Mortality Supermarkets and grocery stores Access/density food retail Dietary intake Food environment Convenience stores Access/density food service Sit-down restaurants * Food retail and food service facilities could also be physical activity destinations. Fast-food restaurants
Sprawl • Development outpaces population growth • Low density • Rigidly separated homes, shops, and workplaces • Roads marked by large blocks and poor access • Lack of well-defined activity centers, such as downtowns • Lack of transportation choices • Relative uniformity of housing options
The County Sprawl Index • Developed by the National Center for Smart Growth • Incorporates 6 Census based measures of • Residential density • Street accessibility • Calculated for the year 2000 • Higher sprawl index = higher density • New York County, NY = 352.1 • Jackson County, GA = 62.6
: Sprawl Index and BMI/Physical Activity: Cross sectional analyses (2000) Adjusted for age, smoking, race, and husband's education James et al. AJPH in press
Objective Measures • By creating buffers around an address we can measure • Residential density • # housing units/area • Land use mix • Density of walking destinations • Diversity • Street connectivity • Intersection density • Pedestrian route directness
Land Use Mix Walking destinations: Counts of businesses within the buffers based on stores, facilities, and services from 2006 InfoUSA spatial database on businesses, which include grocery stores, restaurants, banks, etc.
Street Connectivity Intersection Count: Number of intersections within each buffer
Nuances of How Exposure is Defined • Definition of neighborhood is complex • Appropriate buffer size? • Types of buffers? • Are people actually “using” their neighborhood? • How are people actually “using” businesses
Location, Location, Location • Knowing a person’s address, or better yet residential history, gives us the opportunity to estimate a multitude of environmental exposures • Residential address allows relatively inexpensive assessment of exposures unknown to the participant
Location, Location, Location • Meaningful environmental assessments can be made at the area and personal level • There are limitations and sources of error not discussed here • GIS is a powerful tool for inexpensively incorporating assessment of environmental exposures into large cohorts • Bounds only defined by what has been georeferenced in the appropriate space and time
Acknowledgments • Jaime Hart • Philip Troped • Peter James • Jeff Yanosky • Steve Melly • Christopher Paciorek • Biling Hong • Robin Puett • Jennifer Weuve • Donna Spiegelman • Marc Weisskopf • Natalia Palacios • Andrea Roberts • Andrew Kinlock