Download
1 / 16
160 likes | 256 Views
Learn how to calculate Breakeven and Shutdown Prices in production analysis, determine max profit using TR and TC graphs, and analyze MR and MC interaction for optimal production.

E N D
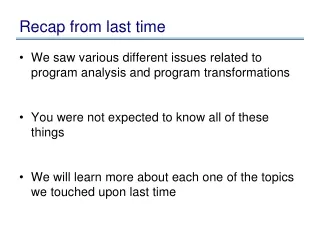
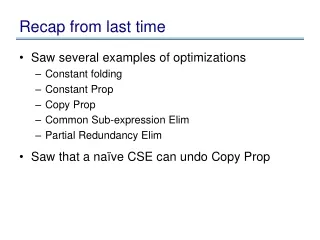
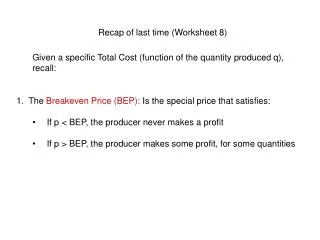
Recap of last time (Worksheet 8) Given a specific Total Cost (function of the quantity produced q), recall: • The Breakeven Price (BEP): Is the special price that satisfies: • If p < BEP, the producer never makes a profit • If p > BEP, the producer makes some profit, for some quantities
$ TC Breakeven Price = slope of the lowest diagonal line tangent to TC Pick a good point on this line: (450, 1100) Our BEP =1100/450=2.44 ($ per hat) hats 0
$ Slope of this line= TC(50)/50= =AC(50) Slope of this line= TC(200)/200= AC(200) (lower than previous!) Slope of this line= TC(400)/400= AC(400) (lower still!) Note: BEP = minimum AC hats
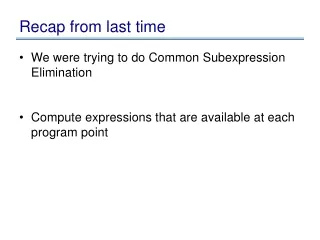
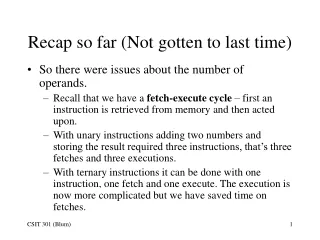
Also, given a specific Total Cost (function of the quantity produced q), recall: • The Shutdown Price (SDP): Is the special price that satisfies: • If p < SDP, the producer never makes a profit AND loses more money than the fixed costs if he/she produces any hats.One should shut down and produce nothing! • If p > SDP, the producer will at least recover some of the fixed cost FC, for some quantities, so it’s best to stay open a while.
$ Shutdown Price = slope of the lowest diagonal line tangent to VC VC Pick a good point on this line: (600, 900) Our SDP =900/600=1.5 ($ per hat) hats 0
TC $ TR line for a price p between SDP and BEP If 750 hats are made,the loss = -$200 If zero hats are made,the loss = -FC = - $600 hats 0
TC $ If hats are produced,the loss is always larger than $600! TR line for a price p below SDP If zero hats are made,the loss = -FC = - $600 hats 0
$ Similarly to the situation for BEP (where BEP= min AC) we also have: VC Shutdown Price = slope of the lowest diagonal line tangent to VC = minimum AVC hats 0
Worksheet 9:Analysis of Cost II <Please retrieve the handout for WS 9>
First, draw TR for a market price of p=$2.50 per paperweight. 2.5=slope=500/200 a good point on the line is (200, 500)
Part I of WS 9: Three methods to compute max profit, from graphs: Method 1: Given the graphs of TR and TC recall that the max profit occurs where we see the greatest max distance between the graphs of TR and TC, (with TR on top). Rolling ruler: hold ruler vertical and move across, searching for the largest “gap”. Looks like max profit occurs at about q=650 paperweights.
Preparation for Methods 2 & 3: • From WS 3, recall that profit is maximized at the first quantity where we go from MR>MC (increasing profit) to MR<MC (decreasing profit). • Also recall that MR=ΔTR if Δq=1. • In our case, MR=$2.50, always. • Note: If we are in a market case situation, i.e. each item sells for the same price $p, then TR is a diagonal line of slope p • and MR(q)=p for every value of q. • Similarly, MC=ΔTC if Δq=1. • In our case, since TC is not linear, the value of MC will change, depending on q. • Recall that we can think of MC as the slope of a secant line through the TC graph at points q and q+1: • slope=rise/run= ΔTC / Δq= ΔTC/1=MC • Issue: The scale of our graph is too big to see a Δq of 1 paperweight! Solution: Use the slope of a tangent line at q to approximate MC(q)
Example: ? .625 MC (200)=? 1. Draw the tangent line at q=200 2. Pick 2 easy to read points:(350, 1000) & (750, 1250)
Method 2: Given the graphs of TR and TC the max profit occurs when MR=MC (switching from MR>MC to MR<MC) i.e. when the graphs for TR and TC have parallel tangent lines (since matching slopes MR=MC)
Method 2: Given the graphs of TR and TC, we look for matching slopes (parallel tangent lines) at the same q. In our example, since TR is already a straight line, its slope (=MR) is always 2.5. So we can align the ruler with TR and move it parallel until it becomes tangent to TC (so MR=MC): Once again, looks like max profit occurs at about 650 paperweights.
Method 3: Given the graphs of MR and MC, we look for their intersection point. Note: If MR greater than MC before, and smaller after, that q gives max profit. Otherwise it gives max loss. The graph of MC is given in the handout, but we need to plot MR. In our example MR is always 2.5, so how do we plot MR versus q? MR(q)=2.5 MR=MC MR So max profit is at q=640 (note: more accurate answer!)