Putting Strategy in Its Place
320 likes | 505 Views
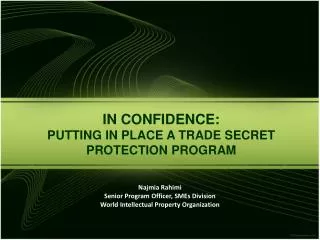
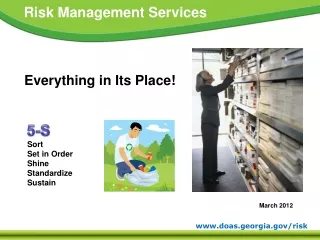
Strategic Analysis · general environment analysis · industry analysis · competitor analysis · resource & capability analysis. Strategy The central integrated, externally oriented concept of how we will achieve our objectives. Implementation · structure · rewards

Putting Strategy in Its Place
E N D
Presentation Transcript
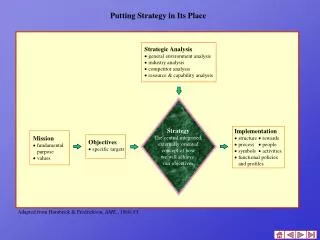
Strategic Analysis · general environment analysis · industry analysis · competitor analysis · resource & capability analysis Strategy The central integrated, externally oriented concept of how we will achieve our objectives Implementation · structure · rewards · process · people · symbols · activities · functional policies and profiles Mission · fundamental purpose · values Objectives · specific targets Adapted from Hambrick & Fredrickson, AME., 19(4):53. Putting Strategy in Its Place
As stated by Prof. Russel W. Olive 1) (Sloan School of Management, MIT), a vision • is a preferred future that the leaders of an organization wish to create. • Successful vision statement will be the one that • comes from the heart; • is personal, is recognizable as ours, and engenders enthusiasm; • is radical and demanding; • meets the needs and interests of important constituencies - customers, stockholders, • and employees; • is based on the organization’s competencies and stresses excellence; • is one part foresight, one part insight, based on creativity and judgement, and is an • expression that embodies courage. • A mission statement is a broadly defined and enduring statement of purpose that distinguishes • a business from other firms of its type and identifies the scope of its operations in product/ • service/market terms. • More specifically, it • defines the product/service areas to be offered; • specifies the primary markets, customer groups, and/or customer needs that will • be served; • states the technology to be used in the production or delivery of the products/services; • expresses the long-term desire for sustained success through growth of profitability. • 1) Russel W. Olive, Creating Manufacturing Strategies for World Class Manufacturers, • Workshop Paper. Jakarta: PITO Indonesia, 1995.
A company mission is designed to accomplish seven outcomes: 1. To ensure unanimity of purpose within the organization. 2. To provide a basis for motivating the use of the organization’s resources. 3. To develop a basis, or standard, for allocating organizational resources. 4. To establish a general tone or organizational climate; for example, to suggest a business-like operation. 5. To serve as a focal point for those who can identify with the organization’s purpose and direction and to deter those who cannot do so from participating further in its activities. 6. To facilitate the translation of objectives and goals into a work structure involving the assignment of tasks to responsible elements within the organization. 7. To specify organizational purposes and the translation of these purposes into goals in such a way that cost, time, and performance parameters can be assessed and controlled.
CORPORATE PERFORMANCE OBJECTIVES: Size, Growth,Profitability, Capital Markets, and Other Financial Measures CURRENT YEAR OBJECTIVE TARGETS PAST YEARS PERFORMANCE INDICATORS 2006 2007 2008 2009 Short Term Long Term Sales Assets Profits Market value Number of employees SIZE Sales Assets Profits Market value Number of employees GROWTH Profit margin Return on assets (ROA) Return on equity (ROE) Spread (ROE - Ke ) PROFIT- ABILITY Dividend yield (Dividend/Price) Total return to investors Price/Earning ratio (P/E) Market-to-book value ratio (M/B) Payout (Dividend/Earning) Price per share (P) Book value per share (B) CAPITAL MARKETS Current ratio Quick ratio Defensive interval Cash position Working capital from operations Cash flow from operations LIQUIDITY Debt-to-equity ratio Short-term vs. Long-term debt Times interest earned Cash flow vs. Interest payments LEVER- AGE Total assets turnover Average collection period Inventory turnover TURN- OVER Bond rating Beta Cost of equity capital (Ke ) Cost of debt Weighted average cost of capital OTHER FINANCIAL
Corporate Performance Objectives For Centralized Functions CURRENT YEAR OBJECTIVE TARGETS PAST YEARS PERFORMANCE INDICATORS Short Term Long Term 2009 2006 2007 2008 Job satisfaction Job performance Turnover Absenteeism Motivation Job security Career prospects Psychological stress Safety health conditions Income Rate of technological innovation R & D productivity Rate of return in R & D investment Resources allocated to R & D Rate of new products introduction Technology-based diversification Royalties or sales of technology Cycle time of product development Cost Service Quality Vendor relationship Cost Delivery Quality Flexibility New products introduction Product strategy Distribution Price strategy Promotion and advertising HUMAN RESOURCES MANAGEMENT TECHNOLOGY PROCURE- MENT MANU- FACTURING MARKETING
The Five Major Elements of Strategy Where will we be active? (and with how much emphasis?) · Which product categories? · Which market segments? · Which geographic areas? · Which core technologies? · Which value-creation stages? Arenas How will we get there? · Internal development? · Joint ventures? · Licensing/franchising? · Acquisitions? What will be our speed and sequence of moves? · Speed of expansion? · Sequence of initiatives? Economic Logic Staging Vehicles How will we obtain our returns? · Lowest costs through scale advantages? · Lowest costs through scope and replication advantages? · Premium prices due to unmatchable service? · Premium prices due to proprietary product features? Differentiators How will we win? · Image? · Customization? · Price? · Styling? · Product reliability? Source: Hambrick & Fredrickson, AME.,19(4):54.
Resources and Capabilities Resources = Capabilities Resources are the source of a firm’s capabilities Capabilities are the main source of a firm’s competitive advantage The collective learning in the organization, especially how to coordinate diverse production skills and integrate multiple streams of technology, e.g. H NEC’s integration of computer and telecommunications technology H Philips’ optical-media expertise H Casio’s harmonization of know-how in miniaturization, microprocessor design, material science, and ultrathin precision casting H Canon’s integration of optical, microelectronic, and pre- cision-mechanical technologies which forms the basis of its success in cameras, copiers, and facscimile machines H Black and Decker’s competence in the design and manu- facture of small electric motors 1. Financial Resources 2. Physical Resources 3. Human Resources 4. Technological Resources 5. Reputation Resources 6. Organizational Resources Grant, CMR., Spring 1991, p. 119 Prahalad & Hamel, HBR., May-June 1990, p. 82.
The Resource-Based Perspective :Why ? Patents Brands Retaliatory capability Market share Firm size Financial resources Process technology Size of Plants Access to Low-cost inputs Brands Product technology Marketing, distribution, and service capabilities Barriers to Entry Monopoly Vertical Bargaining Power Cost Advantage Industry Attractiveness Competitive Advantage Rate of Profit in Excess of the Competitive Level Differentiation Advantage Source: Grant, CMR., Spring 1991, p. 118.
The Relationship Between Resource Heterogeneity and Immobility, Value, Rareness, Imperfect Imitability, and Substitutability, and Sustained Competitive Advantage Value Rareness Imperfect Imitability - History Dependent - Causal Ambiguity - Social Complexity Substitutability Firm Resource Heterogeneity Firm Resource Immobility Sustained Competitive Advantage Source : Barney, JM., No. 1, 1991, p. 112.
The cornerstones of competitive advantage Ex Post Limits to Competition Heterogeneity Rents (Monopoly or Ricardian) Rents Sustained Competitive Advantage Rents Sustained within the firm Rents not offset by costs Ex Ante Limits to Competition Imperfect Mobility Source : Petreraf, SMJ., No. 3, 1993, p. 186.
Desired characteristics of the firm’s recources and capability Complementarity Scarcity Low Tradeability Rents due to Firm’s Resources & Capabilities (Strategic Assets) Overlap with Strategic Industry Factors Inimitability Limited Substitutability Durability Appropriability Source: Amit & Schoemaker, SMJ., No. 1, 1993, p. 38.
Industry Firm Capabilities H information based organizational processes H firm specific H tangible or intangible H intermediate goods Rivals Customer Resources H externally available & transferable H owned or controlled by the firm H convertible Strategic Industry Factors Substitutes Entrants H industry speciffic H R&C subject to market failure H affect industry profitability H change & subject to ex-ante uncertainty Strategic Assets H non-tradable H complementary H scarce Happropriable H firm specific H a subset of the firm’s R&C subject to market failure H overlap with strategic industry factors H uncertain ex-ante H form the basis of the firm’s competitive strategy Hdetermine organizational rents Environmental Suppliers Factors (e.g. technology, regulation) Source: Amit & Schoemaker, SMJ., No. 1, 1993, p. 37.
Sources of Competitive Advantage and Superior Performance Performance Outcomes Strategy Competitive Advantage DISTINCTIVE CAPABILITY * Based on superiority in process management x integration of knowledge x diffusion of learning Capabilities of the Business Core Competencies of the Corporation Business Assets * Scale, scope, and efficiency * Financial condition * Brand equity * Location * Skills and accumulated knowledge * Enable the activities in a business process to be carried out * Span and support multiple lines of business Adapted from: Day, JMkt., No. 4, 1994, p. 40.
Intangible Resources and Capabilities Capabilities Functional Cultural Positional Regulatory Know-how of employees, suppliers, distributors, stockbrokers, lawyers, advertising agents, etc. People Dependent People Independent Skills Assets Perception of quality, ability to learn, ability to react to challenge, ability to change, etc. Reputation, networks Data bases Contracts, Licenses, trade secrets (incl. some data bases), Intellectual prop- erty.rights Functional capability relates to the ability to do specific things. Cultural capability incorporates the habits, attitudes, beliefs and values, which permeate the individuals and groups which comprise the organization. Positional capability is a consequence of past or previous actions and decisions. Regulatory capability results from the possession of legal entities. Such legal entities are all defendable, in some fashion, in law. Source : Hall, SMJ., No. 8, 1993, pp. 610-611.
Intangible resources, capability differentials and sustainable competitive advantage TYPE OF CAPABILITY DIFFERENTIAL TYPE OF RESOURCE S U S T A I N A B L E C O M P E T I T I V E A D V A N T A G E ASSETS ASSETS WITHIN A LEGAL CONTEXT Contracts Licenses Intellectual Property Trade Secrets Owned Physical Resources REGULATORY DIFFERENTIAL (Protectable in Law) ASSETS WITHOUT A LEGAL CONTEXT Reputation Networks Databases POSITIONAL DIFFERENTIAL (Due to Previous Endeavor) COMPETENCIES KNOW-HOW Employee Know-How Supplier Know-How Distributor Know-How etc. FUNCTIONAL DIFFERENTIAL (Due to Skills & Experience ) ORGANIZATIONAL CULTURE Perception of quality Ability to Manage Change Perception of Service etc. CULTURAL DIFFERENTIAL (Aptitudes of the Organization) Source: Hall, SMJ., No. 2, 1992, p. 144.
The relationship between the flexibility of resources and the type of market Unrelated Financial Resources: (Internal Funds) (Low-Risk Debts) M A R K E T Intangible Assets T Y P E O F Financial Resources: (Equity Capital) (Junk Bonds) Physical Resources Intangible Assets Related Low High FLEXIBILITY OF RESOURCE CLASSES Source: Chatterjee & Wernerfelt, SMJ., No. 1, 1991, p. 37. Last
A skill or important expertise ● low-cost manufacturing capabilities ● strong e-commerce expertise ● technological know-how ● skills in improving production processes ● a proven track record in defect-free manufacture ● expertise in providing consistently good customer service ● excellent mass merchandising skills ● unique advertising and promotional talents Valuable physical assets ● state-of-the-art plants and equipment ● attractive real estate locations ● worldwide distribution facilities ● ownership of valuable natural resource deposits Valuable human assets ● an experienced and capable workforce ● talented employees in key areas ● cutting-edge knowledge and intellectual capital ● collective learning embedded in the organization and built up over time ● proven managerial know-how
Valuable organizational assets ● proven quality control systems ● proprietary technology ● key patents ● mineral rights ● a cadre of highly trained customer service representatives ● sizable amounts of cash and marketable securities ● a strong balance sheet and credit rating ● a comprehensive list of customers’ e-mail addresses Valuable intangible assets ● a powerful or well-known brand name ● a reputation for technological leadership ● strong buyer loyalty and goodwill Competitive capabilities ● product innovation capabilities ● short development times in bringing new products to market ● a strong dealer network ● cutting-edge supply chain management capabilities ● quickness in responding to shifting market conditions and emerging opportunities ● state-of-the-art systems for doing business via the Internet
An achievement or attribute that puts the company in a position of market advantage ● low overall costs relative to competitors ● market share leadership ● a superior product ● a wider product line than rivals ● wide geographic coverage ● a well-known brand name ● superior e-commerce capabilities ● exceptional customer service Competitively valuable alliances or cooperative ventures ● fruitful partnerships with suppliers that reduce costs and/or enhance product quality and performance ● alliances or joint ventures that provide access to valuable technologies, competencies, or geographic markets Source: Thomson Jr., Strickland III, and Gamble, 2005:89-90.
Example Thomson Jr., Strickland III, and Gamble (2005:93) suggest that market share leadership of Toshiba’s laptop computers throughout most of the 1990’s stemmed from a combination of good resource strengths and capabilities, i.e., its strategic partnerships with suppliers of laptop components, efficient assembly capability, design expertise, skills in choosing quality components, a wide selection of models, the attractive mix of built-in performance features found in each model when balanced against price, the better-than-average reliability of its models (based on buyer ratings), and good technical support services (based on buyer ratings).
The Drivers of Cost Advantage Technical input-output relationships Indivisibilities ECONOMIES OF SCALE Specialization Increased individual skills ECONOMIES OF LEARNING Improved organizational routines Process innovation PRODUCTION TECHNIQUES Reengineering of business processes Standardization of designs and components PRODUCT DESIGN Design for manufacture Location advantages Ownership of low-cost inputs INPUT COSTS Nonunion labor Bargaining power Ratio of fixed to variable costs CAPACITY UTILIZATION Fast and flexible capacity adjustment Organization slack/X-inefficiency RESIDUAL EFFICIENCY Motivation and organizational culture Managerial effectiveness Source : Grant, 2008:227.
The Rarity of Sources of Cost Advantage Likely to Be Rare Sources of Cost Advantage Less Likely to Be Rare Sources of Cost Advantage Learning-curve economies of scale (especially in emerging industries) Differential low-cost access to factors of production Technological “software” Economies of scale (except when efficient plant size approximately equals total industry demand) Diseconomies of scale Technological hardware (unless a firm has proprietary hardware development skills) Policy choices Direct Duplication of Cost Leadership Basis for Costly Duplication Source of cost advantage History Uncertainty Social Complexity --- --- --- --- --- --- * --- --- --- * * * --- --- *** --- ** *** ** *** Low-cost duplication possible May be costly to duplicate Usually costly to duplicate 1. Economies of scale 2. Diseconomies of scale 3. Learning-curve economies 4. Technological “hardware” 5. Policy choices 6. Differential low-cost access to factors of production 7. Technological “software” --- = not a source of costly imitation * = somewhat likely to be a source of costly imitation ** = likely to be a source of costly imitation *** = very likely to be a source of costly imitation Source: Barney, 2007:187.
Identifying the Potential for Differentiation on the Demand Side FORMULATE DIFFERENTIATION STRATEGY What are key attributes ? THE PRODUCT What needs does it satisfy ? * Select product positioning in relation to product attributes Relate patterns of customer preferences to product attributes * Select target customer group By what criteria do they choose ? * Ensure customer / product compatibility What price premiums do product attributes command ? THE CUSTOMERS What are demographic, sociological, psychological correlates of customer behavior ? * Evaluate costs and benefit of differentiation . What motivates them ? Source : Grant, 2008:248..
Identifying the Potential for Differentiation on the Supply Side: Sources of Differentiation in Porter’s Generic Value Chain Unique product features. Fast new product development. Design for reliability/ serviceability Buyers build corporate reputation. MIS that supports innovation and responsiveness to customer needs through close internal coordination. Training that supports goals of quality and responsiveness. Incentives that are consistent with differentiation goals. Developing commitment to customer service. INFRASTRUCTURE ACTIVITIES: SUPPORT ACTIVITIES RESEARCH, DEVELOPMENT, DESIGN HUMAN RESOURCE DEVELOPMENT DEALER SUPPORT & CUSTOMER SERVICE PURCHASING, INVENTORY HOLDING, MATERIALS HANDLING MARGIN WAREHOUSING & DISTRIBUTION SALES & MARKETING Training for customers. Fast, reliable repairs. Availability of spare parts. Training for dealers. Customer credit. PRODUCTION PRIMARY ACTIVITIES Quality and reliability of components and materials Fast manufacturing. Defect-free manufacturing. Ability to produce to customer specification. Wide variety. Fast delivery. Efficient order processing. Sufficient inventories to meet unexpected orders. Advertising that enhances brand reputation. Effective sales force. Quality sales literature. Building brand reputation. Source : Grant, 1995:223; 2002:297; 2008:256 (cf. Porter, 1985:122).
Product Differentiation and Firm Performance: The Analysis of Monopolistic Competition Bases of Product Differentiation and the Cost of Duplication Source of Costly Duplication Basis of Product Differentiation History Uncertainty Social Complexity Low-cost duplication possible May be costly to duplicate Usually costly to duplicate • 1. Product features • 2. Product mix • 3. Linkages with other firms • 4. Product customization • 5. Product complexity • 6. Consumer marketing • Linkages among functions • within a firm • 8. Timing of product introduction • 9. Location • 10. Product reputation • 11. Distribution channels • 12. Service and support --- --- --- * * * * --- ** * --- ** * --- * --- ** --- * * ** *** * --- *** --- --- *** ** *** ** * ** * * ** Source: Barney, 2007:217. --- = not likely to be a source of costly duplication * = somewhat likely to be a source of costly duplication ** = likely to be a source of costly duplication *** = very likely to be a source of costly duplication
The Strategy clock: competitive strategy options Differentiation 4 Focused differentiation Hybrid 3 5 Low price 2 6 7 1 ‘No frills’ Strategies destined for ultimate failure 8 HIGH PERCEIVED ADDED VALUE LOW LOW HIGH PRICE Needs/risks 1. ‘No frills’ 2. Low price 3. Hybrid 4. Differentiation (a) Without price premium (b) With price premium 5. Focused differentiation 6. Increased price/standard value 7. Increased price/low value 8. Low value/standard price Likely to be segment specific Risk of price war and low margins/need to be cost leader Low cost base and reinvestment in low price and differentiation Perceived added value by user, yielding market share benefits Perceived added value sufficient to bear price premium Perceived added value to a particular segment, warranting price premium Higher margins if competitors do not follow/risk of losing market share Only feasible in monopoly situation Loss of market share Differentiation Likely failure Source: Johnson, Scholes, and Whittington, 2008:.225.
Relatively few managerial layers in order to reduce overhead costs. Cost-effective management information systems. Simplified planning practices to reduce planning costs. Firm Infrastructure Intense and effective training programs to improve worker efficiency and effectiveness Consistent policies to reduce turnover costs. Human Resource Management MARGIN Investments in technologies in order to reduce costs associated with a firm’s manufacturing processes. Easy-to-use manufacturing technologies. Technology Development Systems and procedures to find the lowest cost (with acceptable quality) products to purchase as raw materials. Frequent evaluation processes to monitor supplier’s performances. Procurement Highly efficient systems to link suppliers’ products with the firm’s production processes. Use of economies of scale to reduce production costs A delivery schedule that reduces costs. Efficient and proper product installations in order to reduce the frequency and severity of recalls. A small, highly trained sales force. MARGIN Products priced so as to generate significant sales volume. Construction of efficient-scale production facilities. Selection of low-cost transportation carriers. Service Operations Outbound Logistics Marketing and Sales Inbound Logistics Examples of Value-Creating Activities Associated with the Cost Leadership Strategy Source: Hitt, Hoskisson & Ireland, 2007:111.
Highly developed information systems to better understand customers’ purchasing preferences. A company-wide emphasis on the importance of producing high-quality products. Firm Infrastructure Somewhat extensive use of subjective rather than objective performance measures. Superior personnel training. Compensation programs intended to encourage worker creativity and productivity Human Resource Management MARGIN Investments in technologies that will allow the firm to produce highly differentiated products. Strong capability in basic research Technology Development Systems and procedures used to find the highest quality raw materials. Purchase of highest quality replacement parts. Procurement Superior handling of incoming raw materials so as to minimize damage and improve the quality of the final product. Consistent manufacturing of attractive products. Accurate and responsive order- processing procedures. Extensive buyer training to assure high-quality product installations. Extensive granting of credit buying arrangements for customers. MARGIN Rapid responses to customers’ unique manufacturing specifications. Complete field stock- ing of replace- ment parts. Rapid and timely product deliveries to customers. Extensive personal relationships with buyers and suppliers. Marketing and Sales Service Operations Outbound Logistics Inbound Logistics Examples of Value-Creating Activities Associated with the Differentiation Strategy Source: Hitt, Hoskisson & Ireland, 2007:117.