Download
1 / 10
100 likes | 247 Views
Selection against heterozygotes = underdominance (Fig. 5.19a-c). Selection against heterozygotes = underdominance (Fig. 5.19d-e). Selection against heterozygotes = underdominance (Fig. 5.19f).

E N D
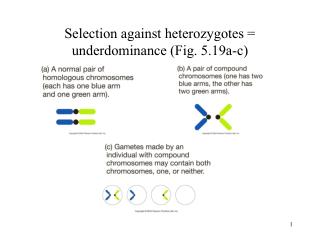
Selection against heterozygotes = underdominance (Fig. 5.19a-c)
Selection against heterozygotes = underdominance (Fig. 5.19d-e)
Selection against heterozygotes = underdominance (Fig. 5.19f) Change in chromosome frequency in populations that are a mixture of normal 2nd chromosomes - N(2) - and compound 2nd chromosomes - C(2) Heterozygotes die. Graph legend gives proportion of viable zygotes in matings between C(2) homozygotes, between C(2) and N(2) homozygotes, and between N(2) homozygotes. Frequency of C(2)
Selection against heterozygotes = underdominance – 2 • When C(2) is common (> 0.90), most matings are between C(2) homozygotes, which produce 25% viable offspring, and C(2) increases toward fixation • When C(2) is less common (< 0.80), enough matings occur between N(2) homozygotes, which produce 100% viable offspring, that N(2) chromosomes can increase in frequency and C(2) is driven out of the population • Main point: the outcome of underdominant selection depends upon the initial allele frequencies • Other forms of chromosome rearrangements (translocations, inversions) can also result in underdominant selection
Frequency dependent selection: flower color in Elderflower orchids • Orchids have yellow or purple flowers • Bumblebees visit flowers and act as pollinators, but receive no nectar • Less common color morph will receive more bee visits per flower because bees tend to alternate between the two color morphs • Flowers that are visited more frequently donate more pollen (= greater male reproductive success) and receive more pollen (= greater female reproductive success) • Therefore natural selection favors the rare color morph
Frequency-dependent selection: Elderflower orchids (Fig. 5-21) Natural selection (via pollinators) favors yellow-flowered plants when they are rare but not when they are common
Adding mutation to the Hardy-Weinberg analysis • Mutation is the ultimate source of new genetic variation • However, by itself, mutation is a weak force for changing allele frequencies
Mutation-selection balance – 1 • Mutation constantly introduces new (mostly less fit) alleles into populations • Selection tends to remove less fit alleles • Could the observed frequency of low fitness alleles in populations be the result of a balance between mutation and selection? • For a recessive allele with a selection coefficient against homozygotes of s, the equilibrium frequency, qeq = √(µ/s), where µ is the mutation rate to the recessive allele • Rearranging this equation: µ = s (qeq)2
Mutation-selection balance and spinal muscular atrophy • Autosomal recessive lethal • Affects about 1 in 10,000 Caucasians (q2 = 0.0001, therefore q = 0.01, which is the collective frequency of disease causing alleles) • If q = 0.01 and s = 0.9 (i.e., 90% mortality for homozygotes), then µ = 0.9 x (0.01)2 = 0.9 x 10⁻⁴ • This estimate of the mutation rate to disease causing alleles of the telomeric survival motor neuron gene (telSMN) agrees well with direct estimates from sequencing alleles in affected individuals and their parents (1.1 x 10⁻⁴) • It appears that mutation-selection balance can explain the observed frequency of spinal muscular atrophy