Download
1 / 23
240 likes | 628 Views
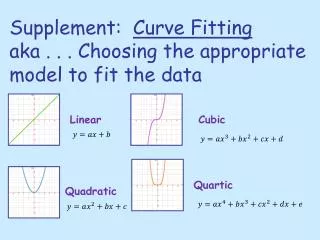
Supplement: Curve Fitting aka . . . Choosing the appropriate model to fit the data. Cubic. Linear. Quartic. Quadratic. Linear family Domain : ℝ Range: ℝ One y-intercept Positive or negative slope. Quadratic Family Domain : ℝ Range: depends on vertex

E N D
Supplement: Curve Fittingaka . . . Choosing the appropriate model to fit the data Cubic Linear Quartic Quadratic
Linear family • Domain: ℝ • Range: ℝ • One y-intercept • Positive or negative slope.
Quadratic Family • Domain: ℝ • Range: depends on vertex • Opens up (positive a) or down (negative a)
Cubic Family • Domain: ℝ • Range: ℝ • Increases left to right (positive a) or decreases left to right (negative a)
Quartic Family • Domain: ℝ • Range: depends on relative maxima/minima • Opens up (positive a) or down (negative a)
Curve Fitting: Find the curve of best fit for a given set of data. This means finding an equation that models the data closely with the smallest error. There are several options; we will concentrate on the bolded ones in this unit: • Linear • Quadratic • Cubic • Quartic • Logarithmic • Exponential • Power • Logistic • Sinusoidal • Parts of this lesson adapted from: • www.adventures-in-education.com/Books/Linear and Curve Fitting.htm • www.usciences.edu/~lvas/Math101/Poly_Regressions.pdf
Remember Linear Regression? Let’s review it. Turn on STAT PLOT 1. Input the data into L1 and L2. ZOOM9:ZoomStat STAT CALC 4:LinReg ENTER VARS Y-VARS 1:Function ENTER FUNCTION 1:Y1 ENTER ENTER If you do not get R and R2 turn DIAGNOSTICS ON.
If the data is NOT linear, you need to explore other options. Linear1Y Quadratic2Y 0.6 0.4 0.2 0 -0.2 -0.4 -0.2 -0.2 -0.2 -0.2 -0.2 Use successive differences between the y-values to determine which model fits best. If the first are equal (or closest to each other) then it is linear; if second equal, then quadratic; if third equal, then cubic, etc.
If the data is NOT linear, you need to explore other options. Turn on STAT PLOT 1. Input the data into L1 and L2. ZOOM9:ZoomStat STAT CALC 5:QuadReg ENTER VARS Y-VARS 1:Function ENTER FUNCTION 1:Y1 ENTER ENTER Looking at the graph, it is obvious that the data is not linear!
Sometimes things are not quite clear. What would you choose for this blind data set. Linear1Y Cubic3Y Quadratic2Y Quartic4Y 4 1 -1 -2 2 3 12 -3 -2 1 5 1 9 1 3 4 4 8 2 1 0 4 The cubic looks the most promising. Or you can try putting the quadratic in Y1, the cubic in Y2, and the quartic in Y3.
Input the data into L1 and L2. ZOOM9:ZoomStat STAT CALC 5:QuadReg ENTER VARS Y-VARS 1:Function ENTER FUNCTION 1:Y1 ENTER ENTER (Record the r2 value.) STAT CALC 6:CubicReg ENTER VARS Y-VARS 1:Function ENTER FUNCTION 2:Y2 ENTER ENTER (Record the r2 value.) STAT CALC 7:QuartReg ENTER VARS Y-VARS 1:Function ENTER FUNCTION 3:Y3 ENTER ENTER (Record the r2 value.) Y= (change line types)
The data increases then decreases and then increases which more closely resembles a CUBIC polynomial. Therefore, the CUBIC is the more appropriate model with R2=.9910. Also, when you ZoomOut, it is clear that the QUARTIC is not an appropriate model.
Healthcare costs have been increasing over the years. The following data shows the average cost of healthcare per person from 1976 to 1998. Let x = 0 denote 1970. find a model that fits the data well. Then find the year when the average healthcare cost reached $2800 per person. Input data into L1 and L2. Run quadratic, cubic, and quartic regressions sending equations to Y1, Y2, and Y3 respectively. Record the R2 values.
Let x = 0 denote 1970. Find a model that fits the data well. Then find the year when the average healthcare cost reached $2800 per person. Discussion: It is important to examine the graphs while zooming out from the data rather than just comparing R2values. The R2indicates how well the curve passes through the data points but does not indicate the correct overall trend or pattern. The cubic model increases the complexity of the equation without changing the value of R2by much. The quartic model appears accurate since R2=1. However, both the cubic and the quartic start decreasing at a certain point which the data does not indicate. Therefore, the quadratic is the best model to choose. Cubic Quadratic Quartic
Clear the cubic and quartic models from Y2 and Y3. Enter 2800 in Y2. Look at the graph. CALC5:IntersectEnter. At First curve? prompt, select Enter. At Second curve? prompt, select Enter. Use left/right arrows keys to move cursor to best guess of intersection, then select Enter. 27.5 + 1976 = 2003.5 so in the year 2003, the healthcare costs reached $2800 per person. NOTE: Use the up/down arrow keys to select between curves.
The population in a bacteria culture over 5 days s given in the table below. Find a good model for the data. Estimate the population after 7 days. Input data into L1 and L2. Run quadratic, cubic, and quartic regressions sending equations to Y1, Y2, and Y3 respectively. Record the R2 values. Examine and choose. Answer the question. Discussion: If we are only interested in the first seven days, then all models fit the data closely and we do not need to worry about the overall trend. In this case, the cubic model has a higher R2 value than the quadratic so choose cubic over quadratic. Although the quartic has a slightly higher R2 value than cubic they are almost the same and therefore there is no need to add complexity. The best model is the CUBIC.
Delete the quadratic and quartic models from Y1 and Y3. Enlarge the viewing WINDOW so that you can see the y-value when x=7. Select CALC1:ValueEnter. Type 7Enter. On day 7 there will be approximately 1886 bacteria.
A company decides to develop a cost equation based on the quantity of the product produced in a day. Find a good model. How much will is cost the company to produce 195 units? How many units can they produce for $800? Input data into L1 and L2. Run quadratic, cubic, and quartic regressions sending equations to Y1, Y2, and Y3 respectively. Record the R2 values. Examine and choose. Answer the question. Discussion: The leading coefficients of the cubic (.00033) and the quartic (-.0000098) are so small that they add complexity without adding much to accuracy (very similar R2 values). So . . . Look at the graphs and the data!
Discussion: Using the quadratic model, cost starts to decrease after units while the cubic cost continues to increase. So if you want a prediction for up to 195 units, use the quadratic model; for a prediction after 195 units, use the cubic. The quartic is rules out as it drops off rapidly which is unlike the data. • Using the quadratic model, when x=195, y=$1287. • Using the cubic model, when x=195, y=$1936. • Using the quadratic model, when y=$800, x=42 units. • Using the cubic model, when y=$800, x=41 units. Cubic Quadratic Quartic
The table below shows the concentration of a drug in a patient’s bloodstream t hours after it was administered. Find a CUBIC model with a restricted domain 0.5 t 3. When was the concentration 0.1825 mg/cc? Input data into L1 and L2. Run cubic regression and send equation to Y1. Enclose the equation in parentheses and add the restricted domain using two inequalities. Record the R2 value. Answer the question.
.1825 mg/cc at time = 0.8 and 2.4 hours. )(0.5t3) 9941 Discussion: If we were concerned with overall trend, the increasing nature of a cubic would not be a good model. However, if we are only interested in part of a cubic we can restrict the domain and only concern ourselves with that one section!
After winter break, 3 students came to school sick with the flu. The following table shows the number of students infected with the flu depending on the number of days after the winter break. Find the quadratic and quartic models that fit this data. Which model appears to be a better fit to the data? Using your chosen model, find the day at which the number of infected students reaches the maximum. When will the number of infected students drop to zero? Input data into L1 and L2. Run quadratic and quartic regressions and send equations to Y1 and Y2, respectively. Record the R2 values. Examine and choose. Answer the question.
Quartic has significantly higher R2 value. Use CALCMaximum: Maximum number of infected students is 24 on day 19.5. Use CALC Intersect: Zero infected students on day 33.