Download
1 / 42
420 likes | 517 Views
Explore key statistics and innovative programs shaping North Carolina's K-12 educational landscape. Get insights into school funding, student performance, teacher preparation, and more.

E N D
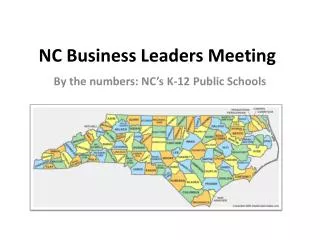
NC Business Leaders Meeting By the numbers: NC’s K-12 Public Schools
Jobs and Education Demand: 2018 State Rank 50% require AA or higher 59% at least some college Source: Projections of Jobs and Education Requirements by 2018, June 2010
Impact of Education Gaps • Metro areas with larger “education gaps”—shortages of educated workers relative to employer demand—had consistently higher unemployment rates than other metro areas from 2005 to 2011. • Metro areas with larger education gaps exhibit greater differences in unemployment rates between highly educated and less educated workers. Education, Unemployment and Demand in Metropolitan America, Brookings, Sept. 2011
Measuring College- and Career-Ready Source: Williamson, Postsecondary Text Readability
NC v US Education Week, 2012
Graduation, NAEP, ABCs, College-going, College-ready Student performance
NC 5-year cohort graduation rateOverall and subgroups, by entering class [10 years ago: Estimated 4-year cohort rate: 57% (DPI Statistical Profile )]
On-time Graduation Rates, Select States Education Week, 2012 (2007-08 data)
College-going rates NC: 65% US: 63%
ACT College-Ready Benchmarks Source: 2011 ACT
At/Above Grade Level on Reading and Math, ABCs New math standards
At/Above Grade-level in Reading and MathAll ethnicities, 2000-2011
Postsecondary pipeline UNC and NC Community College system remediation, persistence and completion rates suggest stronger preparation and new K-12 and higher education completion strategies are needed.
Teachers, administrators, compensation, preparation, evaluation Human capital
NC Public School TeachersCarolina Public Policy Institute, UNC UNC Undergrad Out of State Undergrad NC Private Undergrad Lateral Entry Unclassifiable TFA VIF Private Grad Other Out of State Grad Prep UNC Grad Prep
Newly Hired Public School TeachersCarolina Public Policy Institute, UNC UNC Undergrad Lateral entry Out of State Undergrad NC Private Undergrad VIF TFA UNC Grad Private Grad Other Unclassifiable
Principal Preparation for NC schools • 82% of principals receive master’s degree from a UNC institutions • 18% received degrees from ECU • 11% from UNC-C • 11% from Gardner-Webb • Nontraditional Leadership Academies • 21 just graduated from Northeastern Leadership Academy; 2 others launching through RTTT • New Leaders for New Schools has prepared 19 for Charlotte-Mecklenburg schools
Teacher and Principal Experience Teacher Experience, by grade level Principal Experience Levels
Teacher Attrition Rates, 2006-2011 2010-11 State average: 11.7% Source: NC DPI
Categories, Expenditures, Comparisons School funding
School Funding Comparisons, (Ed Week 2009) *NC ranks 11th in the Nation and 2nd in the Southeast for the highest percentage of funds from State revenue. National average is 45.5%. Table source: Education Week, 2012; * NC DPI
Key initiatives and innovation, challenges ahead Key efforts and challenges
Key Initiatives and Innovations National Leadership • Smart Start and NC PreK • 1 of 6 states meeting all quality standards • 27,000 students • NC Virtual Public Schools School • 2nd largest in the country • 100 courses serving nearly 90,000 students • District and School Transformation • Intervening in 118 schools • District, school, classroom assistance and coaching Innovations • Early colleges • 67 in NC; 1/3rd of all nationally • 32 with no dropouts; only 66 out of more than 12,000 dropped out • Mooresville Graded School District • 1:1 laptop program • Highland School of Technology • 95%+on all state tests • 95% taking SAT • 95%+ graduation rate • Charlotte-Mecklenburg teacher development (MET Project)
Key Approaches and Challenges • Developing teachers and principals: implementing higher standards, making educator evaluation and supports work • Staying the course on Pre-K • New models of schooling that support students and teachers to reach career- and college-ready standards • Routes to certificates, degrees, and jobs, but not a two-track system • Strategic Focus: NC’s Hallmark