Impact of Run-in Period on Test Request Prevalence Timing
30 likes | 124 Views
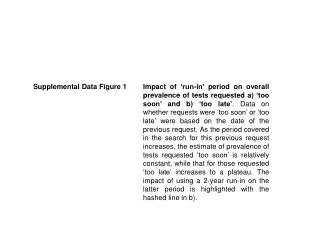
This supplemental data figure illustrates how the 'run-in' period affects the prevalence of tests requested either 'too soon' or 'too late' based on past request dates. The analysis shows a constant prevalence for 'too soon' requests and a plateau for 'too late' requests, with the highlighted impact of a 2-year 'run-in'.

Impact of Run-in Period on Test Request Prevalence Timing
E N D
Presentation Transcript
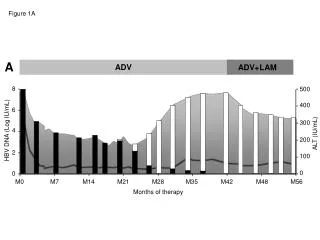
Supplemental Data Figure 1 Impact of ‘run-in’ period on overall prevalence of tests requested a) ‘too soon’ and b) ‘too late’. Data on whether requests were ‘too soon’ or ‘too late’ were based on the date of the previous request. As the period covered in the search for this previous request increases, the estimate of prevalence of tests requested ‘too soon’ is relatively constant, while that for those requested ‘too late’ increases to a plateau. The impact of using a 2-year run-in on the latter period is highlighted with the hashed line in b).
Supplemental Data Figure 1B Estimate based on 2 year ‘run-in’ period