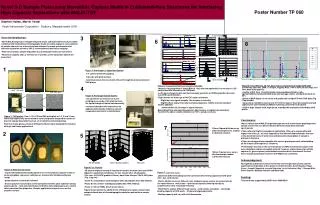
ASMS 2006 Poster number
Conclusions. Experimental. Results and Discussion. Results and Discussion. Results and Discussion. RSD 14.0%. Resp. Factor 1512. Experimental. 100 fg. Resp. Factor 1546. RSD 2.0%. Merge Valley Height 15 %. Peak Accepted. Inspect Peak. Peak Rejected. Merge Valley Height

ASMS 2006 Poster number
E N D
Presentation Transcript
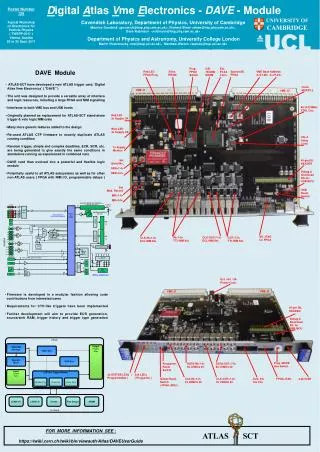
Conclusions Experimental Results and Discussion Results and Discussion Results and Discussion RSD 14.0% Resp. Factor 1512 Experimental 100 fg Resp. Factor 1546 RSD 2.0% Merge Valley Height 15 % Peak Accepted Inspect Peak Peak Rejected Merge Valley Height 39 % Merge Valley Height 54% 1 pg Area 667 Area 676 Resp. Factor 1542 RSD 0.9% 10 pg Area 711 Area 717 Figure 5. Peak validation with regards to merged peaks, andcolor-coding of peak quality. Resp. Factor 1526 RSD 0.8% Area 741 Area 631 100 pg Area 620 Area 654 Resp. Factor 1009 RSD 1.1% 1 ng Area 675 Area 623 RSD 5.4% RSD 6.7% Additional Peaks Performance of a novel parameter-less integrator with built-in peak quality validation for reliable unsupervised integration of triple quad MRM dataLee H. Altmayer1; Frank E. Kuhlmann11Agilent Technologies Inc., Santa Clara, CA ASMS 2006Poster number Introduction Conclusions Chromatographic peak integration is a crucial step in triple quad MRM quantitation and has a significant impact on the time required for data review. Traditional integrators based on derivative approaches are often difficult to set up for proper integration across the dynamic range, require smoothing of the original chromatograms, perform poorly when approaching the limit of detection, and require time consuming manual re-integration. We describe a novel automatic, parameter-free integration algorithm (Patent pending) specifically constructed and optimized for MRM triple quad data, which does not use noise-amplifying derivatives and peak-distorting filtering. In addition, validation routines determine the quality of each integrated peak and designate it as accepted, questionable or rejected based on different criteria. The algorithm of this new integrator is described and the performance demonstrated by applying it to several sets of typical triple quad MRM data, and comparing it to a derivative-based integrators with regards to unacceptable integration of real peaks (peak start, peak end, and baseline positioning. The test data exhibits varying noise, chromatographic peak widths and signal intensities across the typical linear dynamic range of a triple quad MS This requires the user typically to supervise the integration, re-process after tedious adjustment of the integration para-meters or conduct time-consuming manual re-integration. Often smoothing is applied to allow an integrator to properly find the start and end points of a peak. This bears the danger of oversmoothing with inclusion of additional peak area, and often requires justification in audits. Since the new integrator described here does not use derivatives but a matched filter, it successfully can discriminate between peaks and spikes due to their different frequency domains and reliably detect peaks at the lowest level in noisy data (see Fig. 9). • Step 4: For all data points designated to be part of a peak, the algorithm then finds the apex points of each peak and ‘ski’s down the slopes to find the peak start and end. • Step 5: If necessary, the algorithm will adjust the width of the applied filter to match the found chromatographic peak width and computes one or several additional passes. • Step 6: The integration algorithm then determines the baseline via regression analysis of a series of baseline points to the left and/or right of each peak, which were identified using the histogram in Step 2, and can be visua-lized in the chromatogram via boxes (Fig. 4, 5, 7, 9, 11). • Step 7: Finallythe integrator will determine the peak area between the baseline and the interpolated start and end points of the peak on the chromatogram. • Step 8: For each peak, the algorithm then tests the peak quality with regards to the following criteria, and classifies them as ‘Accepted’, ‘Inspect’ or ‘Rejected’ (see Fig. 5+8). • Peak height • Peak area • Peak width • Peak symmetry • Merged peaks to the right or left • Level of spikes on a peak • For example, if there are merged peaks to the right and left, and the height of the adjacent merged valleys exceeds 20%, a peak is flagged as ‘to be inspected’; if it is above 50% the peak will be rejected (see Fig. 5). Fig 1. Chromatogram with 2 peaks and spikes The peak validation criteria are configured conservatively, such that in all cases where the integrator accepts a compound peak, it was properly integrated, down to concentrations below the lower limit of quantitation. It was found that when focusing only on peaks not accep-ted by the peak validation, average time savings of 60 - 90 min. per 1000 integrated compound peaks can be achieved in the data review of large multi-compound batches. The interface of the new MassHunter Quantitative Analysis software allows to filter for and quickly browse through samples with compound peaks in question (see Fig. 8). Peak Rejected Fig 8. Flagging of peaks as ‘Accepted’, ‘Inspect’ or ‘Rejected’in the Agilent MassHunter Quantitative Analysis Future work will focus on modifications to improve the performance of the algorithm for GC/MS chromatograms, which are likely to feature baseline drifts and a larger amount of peaks, and possibly for non-MS data such as UV chromatograms. The use of integrators which can operate unsupervised and do not require adjustments of parameters can result in huge productivity gains. Fig 2. Sorted Histogram => peaks, spikes, baseline points Test Data Most of the data used in this work was acquired using an early prototype of an Agilent 6410 Triple Quad LC/MS system. In order to demonstrate the performance of the integrator on noisy data, no time or spike filtering was applied during acquisition. Data was acquired and analyzed using the Agilent MassHunter Workstation software. Fig 3. Creating a Matched Filter chromatogram • The new parameter-less integrator specifically designed for triple quad MRM data proved to reliably integrate peaks down to and below the LOQ level without user intervention, eliminates the timely adjustment of integration parameters or manual reintegration. • The integrator is able to efficiently distinguish between spikes and peaks, ignoring the spikes during integration. • In all cases where the integrator did not mark integrated peaks as questionable, peaks were properly integrated. • Between the elimination of tedious setup of integration parameters, minimizing the need for manual integration, and the ability for the user to focus only on peaks which are flagged as ‘Inspect’, the new integrator allows huge time savings in the analysis and the review fo large multi-compound batches. points are baseline points, and which are non-baseline points (belonging to a peak or a spike). It also determines the average intensity of all baseline points as the approximate ‘baseline offset’ (see Fig. 2) and the RMS. Step 3: The algorithm then tests each of the non-base-line data points whether they are part of a peak or a spike by applying a filter, starting with the highest point, as follows. For each point, adjacent data points to the right and left in the original chromatogram are added, leaving out the tested data point itself. For each adjacent point, the ‘baseline offset’ as determined in Step 2 is subtracted. The process is illustrated in Fig. 3 for a starting filter width of 7 data points. If the resulting value is zero or negative, as for the brown spike, the data point is designated a spike point. If the resulting value is positive, it is designated a peak point. Figure 7. Comparison of parameter-less integrator with andwithout previous smoothing on 5 inj. of 670 fg ofHomocysteine (transition 136 > 90 m/z) on column. Traditional derivative based integrators often divide the main peak into several peaks or miss peaks, and produce numerous peaks from spikes and disturbances on the baseline toward the lower limit of detection (see Fig. 4). Parameter-Free MSMS Integrator Algorithm (AutoMagic) The new algorithm was applied to the sample chromato-grams. The algorithm consists of the following main steps. Step 1: The input to the algorithm are the x/y data points in the chromatogram (see Fig. 1, illustrated chromatogram with 2 peaks and 2 spikes). Step 2: The algorithm creates a histogram of all data points in the chromatogram sorted by their intensity. Using regression analysis, the algorithm determines which data Smoothing in fact is not advised since it will reduce the frequency domain of noise and spikes, and results in additional integrated peaks. As can be seen, the RSD’s for repetitive injections are similar whether integrating unsmoothed or smoothed data (see Fig. 7) When encountering merged peaks such as for diastereoisomeric drugs and their metabolites the new integrator is able to properly calculate peak areas, but will start to flag peaks as ‘to be inspected’ or ‘rejected’, if the merge valley exceeded certain threshold values (see Fig. 5). Traditional derivative-basedIntegrator Addition.Peaks Missed Peaks Bad Baseline Parameter-LessMSMS Integrator Fig. 6 Performance of parameter-less integrator over 4 orders of magnitude dynamic range; inj. amounts of Bentazon(trans. 238.9 > 132) were 100fg (LOQ) – 1ngon column. Figure 4. Traditional derivative-based integrators need tedious adjustment of integration parameters


![[INSERT] Poster number (eg P324, or OP212). Title of your poster.](https://cdn3.slideserve.com/6811451/slide1-dt.jpg)