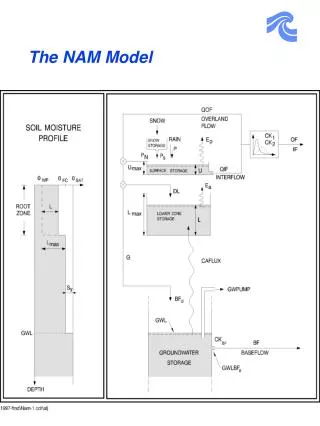
The NAM Model
The NAM Model. Evaporation. Overland flow. The excess rainfall, P N , is divided between overland flow and infiltration. Overland flow. The overland flow varies with the soil moisture:. Overland flow. The overland flow varies with the soil moisture:. Interflow. QIF. Groundwater recharge.

The NAM Model
E N D
Presentation Transcript
Overland flow The excess rainfall, PN, is divided between overland flow and infiltration
Overland flow The overland flow varies with the soil moisture:
Overland flow The overland flow varies with the soil moisture:
Interflow QIF
Groundwater storage & baseflow a) Standard linear reservoir BF = H / CKBF for H 0 BF = 0 for H < 0 BF baseflow H water level in groundwater storage CKBF reservoir time constant b) Shallow groundwater reservoir BF = (GWLBF0 - GWL) Sy / CKBF for GWL GWLBF0 BF = 0 for GWL > GWLBF0
Rainfall data Required: catchment rainfall Available: point rainfall, usually Estimation of catchment rainfall: • Thiessen • Kriging and splines • etc. Data requirements: • How many stations? • Depends on catchment topography • min. recommended: 1 per 1000 km2 • Frequency of observation? • Depends on regime and study objectives • Flood forecasting: hourly or better • water balance studies: daily
Potential Evaporation Two possible data sources: a) Pan evaporameter Often a low data accuracy: • dependent of the surroundings • large variation in pan coefficient • good maintenance important Monthly data normally within 10% accuracy b) Calculation from climate variables, e.g. Penman-Monteith: • net radiation • wind speed • temperature • relative humidity Daily or monthly data can be used Generally more reliable than pan data Selection of data type depends also on availability
Main NAM parameters Umax Maximum contents of surface storage Evaporation; small peaks Usual value: 10-25 mm Lmax Maximum contents of rootzone storage Evaporation; water balance Usual value: 50-250 mm CQof Overland flow coefficient Divides excess rainfall in runoff and infiltration Usual value: 0.01 - 0.99 TOF Rootzone threshold value for overland flow Delays overland flow at the beginning of a wet season Usual value: 0.0 - 0.7
Main NAM parameters TG Root zone threshold value for recharge Delays groundwater recharge at the beginning of a wet season Usual value: 0.0 - 0.7 CKBF Time constant for routing baseflow Determines shape of baseflow hydrograph Usual value: 500 - 5000 hours CK1 ,CK2 Time constant for routing overland flow Determines shape of peaks Usual value: 3 - 48 hours
NAM calibration 3 - 5 years of observed runoff Graphical comparison with simulation: Statistics in file: RRstat.txt Recommended procedure: 1. Initial, approximate adjustment of: • Lmax and Umax for water balance • CQof andCK1,2 for peaks • CKBF for baseflow 2. Repeat for further parameter adjustment: • identify a parameter change, likely to improve the calibration • change this parameter only • make significant changes the first time