Download
1 / 43
430 likes | 505 Views
National consultation in Bangkok on HBV and VMod hydrological models applied in Nam Songkhram. Discussing calibration, validation results, scenarios, and development plans for the 3D EIA model. Input data includes cross-sections, field measurements, satellite images, and model areas. Area spans 13,126 km² with varying elevations. Specific application areas include Ban Tha Sri, Chomchun, Nong Yang, Tha Kok Daeng, Khon Sai, and Phok Yai. HBV model covers five subcatchments with satisfactory parameter optimization. VMod model employs a 2D distributed approach with calibration on discharge stations. EIA 3D Hydrodynamic model includes water quality aspects and operates on a 500m grid resolution for floodplains. New data sources include pumping and water quality information, as well as recent satellite imagery for flood analyses. Data input status updated for both hydrological and EIA 3D models. Fieldwork at Ban Chai Buri entails current and water quality measurements. HBV calibration and validation results showcase model accuracy, and VMod introduces new features for river regulation and irrigation control.

E N D
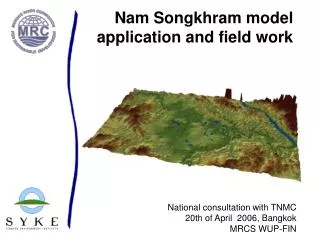
Nam Songkhram model application and field work National consultation with TNMC 20th of April 2006, Bangkok MRCS WUP-FIN
Outline • Models applied and model areas • Input data • Cross sections • Field measurements • Satellite images • Etc. • HBV and VMod hydrological models • Calibration results • Validation results • Scenarios • VMod manual • 3D Hydrodynamic model • Calibration results • Validation result • Scenarios • Development and continuation • 3D EIA model manual
Area: 13,126 km2 Elevation: min 135 m amsl max 675 m amsl Nam Songkhram application areas
Ban Tha Sri Chomchun Ban Nong Yang Ban Tha Kok Daeng Ban Khon Sai Ban Phok Yai HBV Hydrological Model • Simple lumped hydrological model • HBV model has been set up for five subcatchments in the Nam Songkhram watershed • The size of the model areas varies between 625 and 5029 km2 • Simple optimisation of the model parameters completed with good results
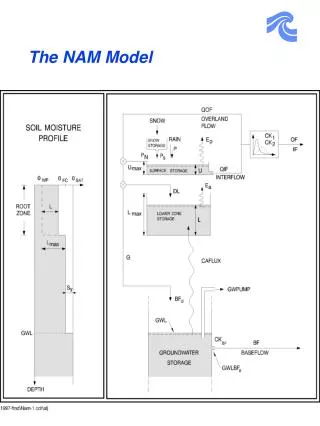
VMod Hydrological model • 2D distributed hydrological model coupled with a 1D hydrodynamic river, reservoir and lake model • Physical model of the application area that takes into account variability in elevations, soil properties, vegetation, land use etc. • 1 km model grid • Flow network computed from DEM and corrected • 5 landuse classes and 5 soil classes • Calibration with five discharge stations is finished
EIA 3D Hydrodynamic model • 3D hydrodynamic model coupled with a water quality model • 500 m grid resolution for floodplain, 50-500 for rivers • 3D hydrodynamics • flood arrival time, duration and depth in different locations of the modelled area, other flood characteristics • Water quality: sediment concentration, net-sedimentation, oxygen, etc • Run through a GIS-type graphical user interface
Input data • Models applied and model areas • Input data • Cross sections • Field measurements • Satellite images • Etc. • HBV and VMod hydrological models • Calibration results • Validation results • Scenarios • VMod manual • 3D Hydrodynamic model • Calibration results • Validation result • Scenarios • Development and continuation • 3D EIA model manual
Input data status – Hydrological models • Digital elevation model • 50 m resolution • Landuse maps (several years, newestfrom 2002) • Soil map • Weather data • 16 precipitation stations • Temperature data from one station • Evaporation, few stations • Flow and water level data • five stations
New data • Pumping data • Data from irrigation projets and structures • Total volumes 675 million m3 • Most (520 million m3) is from Nam Oon • Water Quality data • Satellite images to show the flood extent • Field measurements • Ground water depth
New data, cross sections • Cross sections • 400 cross sections from Nam Songkhram and its tributaries • Have now been digitalized and quality checked • The general information of the cross sections was added to the model
Input data status – EIA 3D Hydrodynamic model • Digital elevation model • 50 m resolution • Channel cross-section data • Landuse maps (several years, newestfrom 2002) • Boundary conditions • Upstream (discharge): Ban Tha Kok Daeng + sub-tributaries & Mekong upstream • Downstream (rating curve): Mekong at Nakhom Phanom • Water level • Flood extent based on satellite images • Field data
Current meter RCM9 • Current speed • Current direction • Temperature • Conductivity • Pressure • Turbidity • Oxygen
Current speed & direction Mekong
HBV and VMod hydrological models • Models applied and model areas • Input data • Cross sections • Field measurements • Satellite images • Etc. • HBV and VMod hydrological models • Calibration results • Validation results • Scenarios • VMod manual • 3D Hydrodynamic model • Calibration results • Validation result • Scenarios • Development and continuation • 3D EIA model manual
HBV calibration results The R2 in calibration period (1987-1991) was • 0.92 for Nam Songkhram at Ban Tha Kok Daeng • 0.80 for Nam Oon at Ban Phok Yai • 0.75 for Nam Yam at Ban Khon Sai • 0.84 for Huai Khong at Ban Tha Sri Chomchun • 0.86 for Huai Hi at Ban Nong Yang red line observed, black line calculated
HBV validation results The R2 of the validation period (1992-1995) was • 0.83 for Nam Songkhram at Ban Tha Kok Daeng • 0.81 for Nam Oon at Ban Phok Yai • 0.70 for Nam Yam at Ban Khon Sai • 0.70 for Huai Khong at Ban Tha Sri Chomchun • 0.76 for Huai Hi at Ban Nong Yang red line observed, black line calculated
VMod program: new developments • Pumping • it is now possible to substract (or add) water from the river (for irrigation) • Regulation • it is now possible to regulate lakes / reservoirs (Nam Oon reservoir) • Improvements in the model calculations
VMod: New development in Nam Songkhram • River data and friction coefficients have been modified • Model has been calibrated • Water quality component has been included, but not yet calibrated • Preliminary (sensitivity) scenarios have been simulated
red line observed, black line calculated VMod calibration • Calibration of the VMod application for Nam Songkhram is ready • The R2 in calibration period (1989-1991) was • 0.90 for Nam Songkhram at Ban Tha Kok Daeng • 0.69 for Nam Oon at Ban Phok Yai • 0.66 for Nam Yam at Ban Khon Sai • 0.78 for Huai Khong at Ban Tha Sri Chomchun • 0.82 for Huai Hi at Ban Nong Yang
red line observed, black line calculated VMod verification • The R2 in test period (1992-1995) was • 0.86 for Nam Songkhram at Ban Tha Kok Daeng • 0.76 for Nam Oon at Ban Phok Yai • 0.78 for Nam Yam at Ban Khon Sai • 0.71 for Huai Khong at Ban Tha Sri Chomchun • 0.58 for Huai Hi at Ban Nong Yang
VMod manual • New version of the VMod manual has been prepared
HBV and VMod hydrological models • Models applied and model areas • Input data • Cross sections • Field measurements • Satellite images • Etc. • HBV and VMod hydrological models • Calibration results • Validation results • Scenarios • VMod manual • 3D Hydrodynamic model • Calibration results • Validation result • Scenarios • Development and continuation • 3D EIA model manual
Modelling: 3D new developments • Channel dimensions and elevations have been modified • Model parametrization has been modified to stabilize the model • Model has been calibrated and validated against satellite data from flood extent and water levels • Preliminary scenarios have been calculated
Flood duration Flood arrival time
Calibration results 17/09/2000
Calibration results 04/11/2000
Verification results 20/09/2001
Effect of Mekong to Nam Songkhram • Backwater effect (Mekong prevents Nam Songkhram outflow) • Has clear effect to flooded areas in Nam Songkhram • The effects can be seen in the model simulations • Reverse flow (Mekong flows into Nam Songkhram) • Depends on the size of the Mekong flood and on the timing of Mekong and Nam Songkhram floods • Greatest when Mekong flood is ahead on the flood in Nam Songkhram
Flood depth- Mekong water level low Flood depth- Mekong water level high
Reverse flow maximum 1999 Reverse flow maximum 1997
Scenarios SRES A2 and B2 climate scenarios for 2070-2099 provided by Hoanh et al. (2003) • Climate change • A2: T = +4.0 C, E = +9.5 %, P = +6.6 %, Mekong = +17 % • B2: T = +2.9 C, E = +6.9 %, P = +0.9 %, Mekong = +6 % • Land use change • Decidious forest – 80 % (from 6 % to 1 %) • Upstream development • DSF upstream development scenario (high development) • Irrigation (upstream and in basin) • DSF upstream irrigation scenario + more irrigation in Nam Songkhram (-5 % NS at BTKD, Nam Yam and Huai Hi)
Procedure • First changes made to VMod input data • Example of the Climate change scenario A2, results from VMod • VMod results used as a new boundary conditions to the EIA 3D model
Climate change A2 Baseline 20/08/2001
Climate change B2 Baseline 20/08/2001
Land use change Baseline 20/08/2001
Upstream development Baseline 05/08/1997
Irrigation Baseline 05/08/1997
Future tasks • Calibrate the water level in the locations where data available • Calibrate the water quality and erosion components to the model • Clarify and execute official scenarios (e.g. irrigation, land use and climatological changes)
Potential use of the model set • Impact of the local and basin wide development on the flooding, water quality, etc • Impact of the climate change (better data of climate change scenarios from SEA START RC) • Landuse change impacts on the hydrology and water quality • Fisheries research • Ecosystem functions and productivity issues (productivity related to the flooded area, vegetation, water quality) • Model basis of the possible flood forecasting work
Working paper • All the information collected there • Will be updated continuosly • Newest version by request
www.eia.fi/wup-fin • Content of the project’s two phases • Personnel & contact details • Documents downloadable • Training portfolio: presentations, documents, exercises
Thank You! MRCS/WUP-FINwww.eia.fi/wup-fin