Download
1 / 9
90 likes | 209 Views
Exercise 2 week 2 Production of Milk-powder Presented by Veronika, Helle & Linnea. The experiment Concentration of maillard reactions products measured at different levels of water activity (3 levels) and temperature (4 levels) = 12 combinations 9 out of 12 combinations tested

E N D
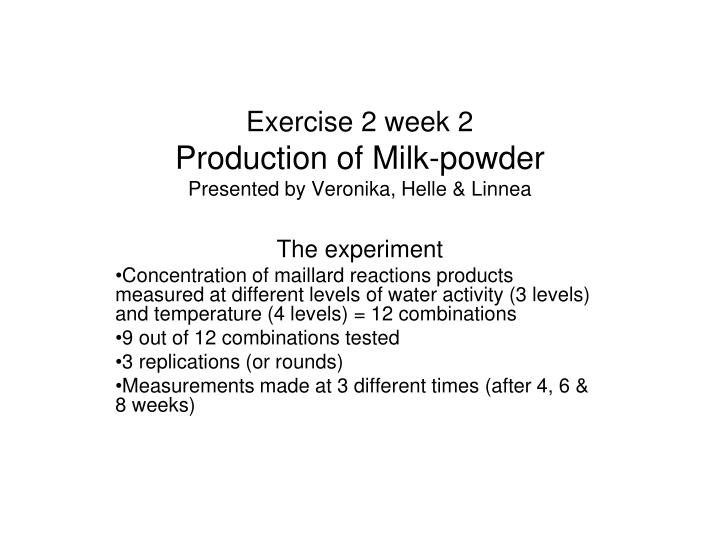
Exercise 2 week 2Production of Milk-powderPresented by Veronika, Helle & Linnea The experiment Concentration of maillard reactions products measured at different levels of water activity (3 levels) and temperature (4 levels) = 12 combinations 9 out of 12 combinations tested 3 replications (or rounds) Measurements made at 3 different times (after 4, 6 & 8 weeks)
Question 1 and 2 > milkpowder<-read.table(file.choose("milkpowder.txt"),header=TRUE) head(milkpowder) rnd week maillard taste water temp 1 1 4 2.90 10.1 1 100 2 1 4 2.13 11.0 1 110 3 1 4 2.00 11.1 1 120 4 1 4 2.13 11.1 2 100 5 1 4 2.38 11.9 2 120 6 1 4 2.56 10.7 2 140 milkw4=subset(milkpowder,week==4) Fixed factors: Water, temperature and their interaction. Random factors: Round The model: Maillardi = α(wateri, temp.i) + d(roundi) + εi
Question 3A mixed linear model for the data from week 4 Defining the interaction between water & temperature milkw4$wt<-with(milkw4,factor(water):factor(temp)) Model1<-lme(maillard~wt,random=~1|factor(rnd),data=milkw4,method="ML") Model2<-lme(maillard~factor(water)+factor(temp),random=~1|factor(rnd),data=milkw4,method="ML") anova(model1,model2) Model df AIC BIC logLik Test L.Ratio p-value model1 1 11 12.630598 26.88480 4.684701 model2 2 8 8.792841 19.15954 3.603579 1 vs 2 2.162244 0.5394 P-value is high -> no combined effect of water and temperature
Question 4 • For the next questions we look at all the 81 observations. • Therefore we need to include more factors. The Maillard reaction products concentration are now also dependent on weeks (fixed factor) as well as sample number (random factor). • Maillardi = α(water,temp,week)i + d(round)i+ e(sample)i + εi
Question 5 and 6 An initial model for the whole dataset • Define the interaction between water and temperature • Define the random factor “sample” milk$wt<-with(milk,factor(water):factor(temp))milk milk$sample<-with(milk,factor(water):factor(temp):factor(rnd)) • The model is fitted in R: modelall1<-lme(maillard~factor(wt)*factor(week),random=~1|rnd/sample,data=milk,method="ML")
Question 6 Reducing the model • Test if the interaction between week and wt is significant. modelall1<-lme(maillard~factor(wt)*factor(week),random=~1|rnd/sample,data=milk,method="ML”) modelall2<-lme(maillard~factor(wt)+factor(week),random=~1|rnd/sample,data=milk,method="ML”) • Test if the interaction between temp and water is significant. modelall2<-lme(maillard~factor(wt)+factor(week),random=~1|rnd/sample,data=milk,method="ML”) modelall3<-lme(maillard~factor(water)+factor(temp)+factor(week),random=~1|rnd/sample,data=milk,method="ML”) • Test the significance of the different factors one by one, e.g modelall3<-lme(maillard~factor(water)+factor(temp)+factor(week),random=~1|rnd/sample,data=milk,method="ML”) modelall4<-lme(maillard~factor(water)+factor(temp),random=~1|rnd/sample,data=milk,method="ML") Test the other factors in the same way by excluding them.
Question 7 Reducing the initial model: modelall3<-lme(maillard~factor(water)+ factor(temp) + factor(week), random=~1|rnd/sample, data=milkpowder, method="ML") modelall1<-lme(maillard~factor(wt)*factor(week), random=~1|rnd/sample, data=milkpowder, method="ML") anova(modelall1, modelall3) Model df AIC BIC logLik Test L.Ratio p-value modelall1 1 30 27.72776 99.56124 16.136119 modelall2 2 11 11.91295 38.25189 5.043524 1 vs 2 22.18519 0.2751 P-value is high no significant difference between the two models no interaction reduce the model to model 3 (water and temperatur and week)
Question 8Model validation of initial model • linear normal model modelallpred<-lm(maillard~factor(wt)*factor(week)+factor(rnd)+factor(sample), data=milkpowder) predicted<-fitted(modelallpred) raw.residuals<-residuals(modelallpred) plot(predicted, raw.residuals) abline(h=c(-1.96*sd(raw.residuals),0,1.96*sd(raw.residuals))) • OK?
Question 8Model validation of initial model Looks ok • QQ plots for random effects one by one • Mixed linear model modelall1<-lme(maillard~factor(wt)*factor(week),random=~1|rnd/sample,data=milk) eblups<-ranef(modelall1) eblups.rnd<-unlist(eblups["rnd"]) eblups.sample<-unlist(eblups["sample"]) qqnorm(eblups.rnd) qqnorm(eblups.sample) abline(0,sd(eblups.rnd)) abline(0,sd(eblups.sample))