Download
1 / 16
160 likes | 285 Views
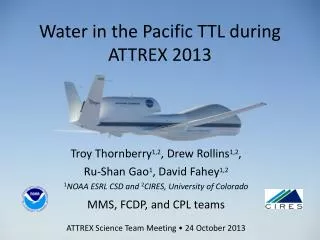
Water in the Pacific TTL during ATTREX 2013. Troy Thornberry 1,2 , Drew Rollins 1,2 , Ru-Shan Gao 1 , David Fahey 1,2 1 NOAA ESRL CSD and 2 CIRES, University of Colorado MMS, FCDP, and CPL teams ATTREX Science Team Meeting • 24 October 2013. ATTREX Flights . Average flight: 7790 nm

E N D
Water in the Pacific TTL during ATTREX 2013 Troy Thornberry1,2, Drew Rollins1,2, Ru-Shan Gao1, David Fahey1,2 1NOAA ESRL CSD and 2CIRES, University of Colorado MMS, FCDP, and CPL teams ATTREX Science Team Meeting • 24 October 2013
ATTREX Flights Average flight: 7790 nm 14300 km 24.4 hrs
ATTREX Flights TTL Profiles ±15° Latitude
Temperature and WV Structure of the TTL • CP Tropopause altitudes between 17 and 18 km on individual profiles • H2O MR < 5 ppm above 16.5 km and as low as 1.5 ppm
Saturation Potential Temperature • Saturated mixing ratios not observed above ~380 K potential temperature surface • Altitude of the 380 K surface typically ~17.5 km (87 hPa) • Cirrus clouds observed with both large supersaturations and subsaturations, although mean values close to 100%
RHice climatology From Krämer et al., ACP, 2009 Data from FISH + FLASH/OJSTER, 9 missions, 1999-2006
Where does the ATTREX data fall? From Krämer et al., ACP, 2009 Data from FISH + FLASH/OJSTER, 9 missions, 1999-2006 • Within the envelope of previous measurements • Temperatures reached not as cold as FISH has seen
ATTREX RF05 26-27 February
Cloud Physics Lidar Longitude
High water content cloud 7 – 15°N 26-27 February 2013 FCDP Data, SPEC Inc., P. Lawson PI
Contrasting cirrus clouds 7 – 15°N 26-27 February 2013
Dehydration by sedimentation • The larger diameter particles will fall much faster, leading to faster downward transport of water • Both types of cloud particles fall much faster than typical ascent rates so should provide dehydration • Effect of observed supersaturations?
Can we use trajectories to inform the data? • In situ data provides a snapshot in time • Tracer species can provide information on air parcel history • Possible to get direct dynamic information? • Trajectories from Tao Wang, Texas A&M • ERA interim reanalysis • isentropic coordinate model with diabatic heating vertical transport
Can we use trajectories to inform the data? • Add calculated saturation H2O MR to look at potential dehydration history
Summary • Dehydration was likely occurring just below 380 K (~ 17.5 km) in the central and eastern Pacific boreal winter • TTL cirrus clouds varied significantly in ice crystal number and size and in supersaturation, yielding a wide range of dehydration potentials • ATTREX RHice observations fit within the envelope from previous studies (Krämer et al, 2009) • Trajectories provide a possibility to investigate the air parcel history and provide context to the snapshot of in situ measurements • Tantalizing, but fraught…