Supplementary Fig. 1
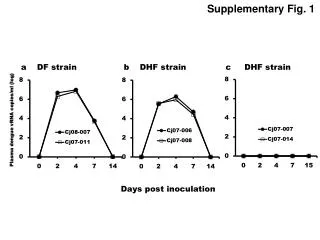
Supplementary Fig. 1. Supplementary Figure 1. Distributions of ( A ) exon and ( B ) intron lengths in O. sativa and A. thaliana genes. Green bars are used for O. sativa and orange bars for A. thaliana .

Supplementary Fig. 1
E N D
Presentation Transcript
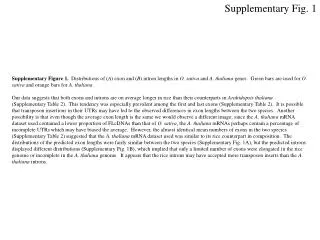
Supplementary Fig. 1 Supplementary Figure 1. Distributions of (A) exon and (B) intron lengths in O. sativa and A. thaliana genes. Green bars are used for O. sativa and orange bars for A. thaliana. Our data suggests that both exons and introns are on average longer in rice than their counterparts in Arabidopsis thaliana (Supplementary Table 2). This tendency was especially prevalent among the first and last exons (Supplementary Table 2). It is possible that transposon insertions in their UTRs may have led to the observed differences in exon lengths between the two species. Another possibility is that even though the average exon length is the same we would observe a different image; since the A. thaliana mRNA dataset used contained a lower proportion of FLcDNAs than that of O. sativa, the A. thaliana mRNAs perhaps contain a percentage of incomplete UTRs which may have biased the average. However, the almost identical mean numbers of exons in the two species (Supplementary Table 2) suggested that the A. thaliana mRNA dataset used was similar to its rice counterpart in composition. The distributions of the predicted exon lengths were fairly similar between the two species (Supplementary Fig. 1A), but the predicted introns displayed different distributions (Supplementary Fig. 1B), which implied that only a limited number of exons were elongated in the rice genome or incomplete in the A. thaliana genome. It appears that the rice introns may have accepted more transposon inserts than the A. thaliana introns.
Supplementary Fig. 1 (Cont.) (A) Exon length
Supplementary Fig. 1 (Cont.) (B) Intron length
Supplementary Fig. 2 Supplementary Figure 2. Proportion of protein lengths in five categories. The first three categories were combined. Short proteins (<300 a.a.) appear to be enriched in Categories IV and V.
Supplementary Fig. 3 Antisense npRNA candidate BTP/POZ domain-containing protein NAM-like protein Supplementary Figure 3. Antisense npRNA in the rice genome. The Os08g0103700(AK071064) npRNA encoded in the forward strand on chromosome 8 overlaps two sense genes: Os08g0103600 (AK067168; BTP/POZ domain-containing protein gene) and Os08g0103900(AK110611; NAM-like protein gene). Other features such as A. thaliana mRNAs and expressed sequence tags (ESTs) are also shown. See the following URL: http://rappub.lab.nig.ac.jp/g-integra/cgi-bin/f_genemap.cgi?id=AK071064
Supplementary Fig. 4 Supplementary Figure 4. Distribution of evolutionary distances (p distance) of orthologs detected between O. sativa and A. thaliana.
Supplementary Fig. 5 Supplementary Figure 5. Distributions of evolutionary distances between paralogs in O. sativa (black bars) and A. thaliana (white bars). The distances were estimated by the Poisson-gamma correction with the shape parameter of 2.25. Even though the distributions of gene duplicates were quite similar between O. sativa and A. thaliana (Fig. 2), the process of genome evolution in each species may have been quite different. If genes are duplicated and deleted on a purely random basis without selection pressure, exponential decay of the duplicate genes over time should be observed. If a large-scale duplication event occurred, we would see a unimodal distribution that peaks at the point of the duplication event (Blanc, G and Wolfe K. H. 2004. Widespread paleopolyploidy in model plant species inferred from age distributions of duplicate genes. The Plant Cell16: 1667-1678). We estimated the Poisson-gamma distances (shape parameter = 2.25) for duplicate protein pairs created after the divergence event between O. sativa and A. thaliana. Here we used only paralog clusters for two members because the evolutionary distances between these paralog clusters could be calculated unambiguously. The distribution of the O. sativa proteins appeared to be a combination of the two aforementioned distributions, whereas in A. thaliana there seems to be a single large peak as noted by Blanc and Wolfe (2004), which may be characteristic of a large-scale duplication. Hence, the different patterns of duplication events are likely to have led to the similar patterns of paralog cluster sizes observed (Fig. 2).
Supplementary Fig. 6 Supplementary Figure 6. Numbers of lineage-specific and other proteins in five ORF categories.
Supplementary Fig. 7 Supplementary Figure 7. Distribution of protein lengths in lineage-specific and other proteins.