Download
1 / 19
190 likes | 296 Views
This study explores the mechanisms regulating microplankton size structure within differing water column environments of the Celtic Sea. It highlights how nutrient availability, sedimentation velocities, and turbulence influence the growth and distribution of microplankton species, particularly focusing on large cells like Coscinodiscus wailesii. The research employs rigorous sampling and analysis methods to understand the impact of water column dynamics on microplankton biovolume and population growth, concluding that thermal dynamics play a crucial role in supporting the development of large phytoplankton blooms.

E N D
Control of microplankton size structure in contrasting water columns of the Celtic Sea 在凱爾特海截然不同的水層環境,如何調控micro級的植浮大小機制 ANDREAS REUL1*, J. RODRI´GUEZ1, J. M. BLANCO1, A. REES2 AND P. H. BURKILL3 JOURNAL OF PLANKTON RESEARCH /VOLUME 28 / NUMBER 5 / PAGES 449–457 / 2006 Reporter: Heng- Ru Guo
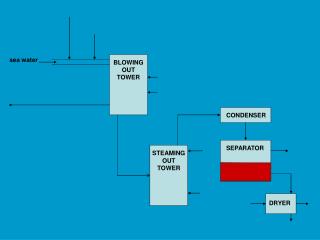
Size nutrient uptake growth rates sedimentation velocities turbulencecan recover cells from the bottom of the mixed layer >1 m day–1 Nutrient availability enhances the growth of large cells (Malone,1980), and changes in the carbon-specific photosynthesis spectra (Cermen˜o et al., 2005a, b) can influence phytoplankton size distribution. turbulence Stratification upwelling
Water samples microplankton (cells >20 mm ESD) nutrient analysis were taken with a CTD-Rosette sampler. 4-L samples 20-μm 50–70 mL seawater(dark bottles) 2% Lugol’s solution. Utermo¨hl chambers (Utermo¨hl, 1958). SAS(size-abundance spectra) log10 of the abundance (cells mL–1) log10 size class (μm3)
TS diagram 35.26 34.7
Microplankton size structure Coscinodiscus wailesii 370μm ESD 4/3πr3
7x105μm3 mL-1 45% 0.7x105 μm3 mL-1 45% 86% 8x105 μm3 mL-1
loss rate [rl =(Vs/Zm)] Sinking velocity (Vs) mixed layer depth (Zm) exponentially growing population (Nt =N0ert) model Nt =N0e-(Vs/Zm)t rl ≦ r rl > r
growth–loss rate ratio (r/rl) rmax = 3.4v–0.13(day–1) (Sarthou et al., 2005) vs = 2.48r1.17 (cm s–1) ( Jackson, 1989 in Kiørboe, 1993).
TD of the water column is an important factor explaining the presence of C. wailesii in the UML, as it would need resuspensionof seeding cells for its development (Ruı´z et al., 2004) if phytoplankton with settling velocities >1 m day–1 are concentrated at the bottom of the mixed layer, larger-scaled turbulence events recover cells and disperse them in the mixed layer (Ruı´z et al., 1996) Station 1, the C. wailesii population might be composed of active growing cells and resuspended resting cells from the sediment. The elevated biovolume of C. wailesii close to the seafloor at Station 3 suggests that cell resuspension may also contribute significantly to the total phytoplankton biovolume.
According to our findings, resuspension promotes the bloom of large cells when the UMLreaches TD and might modify the plankton SAS, resulting in it departing from the linear shape usually found. As stratification occurs, the depth of the UML becomes shallower, and decreasing nutrient availability would increase settling velocities and reduce the growth rate, forcing the larger cells to settle out of the UML.
TD seems to be a key factor for explaining the development of large-celled phytoplankton blooms, either due to the presence of seeding population on the seafloor or due to the prevention of cell lost to deep water. Perturbation at the upper extreme of the phytoplankton SAS might not propagate along the planktonic SAS but rather settle down to the seafloor.