
Uploaded by
zach
1 SLIDES
107 VIEWS
10LIKES
Analysis of Responder and Transactivator Genes in Transgenic Mice
DESCRIPTION
Comparative real-time PCR analysis of responder (GFP) and transactivator (α-MHC-tTA) genes in transgenic mice versus controls. No correlation between GFP and α-MHC-tTA expression observed.
Download
1 / 1
Download Presentation

Download Presentation
Analysis of Responder and Transactivator Genes in Transgenic Mice
An Image/Link below is provided (as is) to download presentation
Download Policy: Content on the Website is provided to you AS IS for your information and personal use and may not be sold / licensed / shared on other websites without getting consent from its author.
Content is provided to you AS IS for your information and personal use only.
Download presentation by click this link.
While downloading, if for some reason you are not able to download a presentation, the publisher may have deleted the file from their server.
During download, if you can't get a presentation, the file might be deleted by the publisher.
E N D
Presentation Transcript
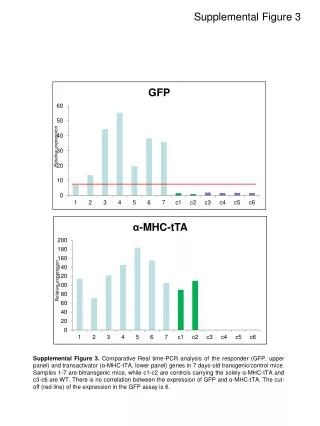
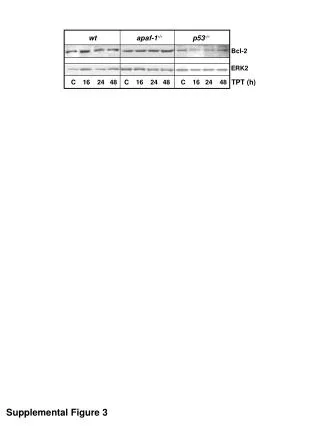
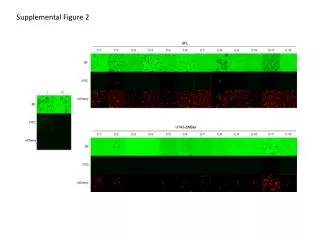
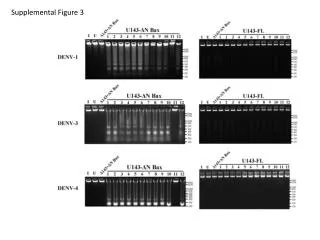
Supplemental Figure 3 Relative expression Relative expression Supplemental Figure 3. ComparativeReal time-PCR analysis of the responder (GFP, upper panel) and transactivator (α-MHC-tTA, lower panel) genes in 7 days-old transgenic/control mice. Samples 1-7 are bitransgenic mice, while c1-c2 are controls carrying the solely α-MHC-tTA and c3-c6 are WT. There is no correlation between the expression of GFP and α-MHC-tTA. The cut-off (red line) of the expression in the GFP assay is 6.

More Related
Audio
Live Player