Download
1 / 20
200 likes | 407 Views
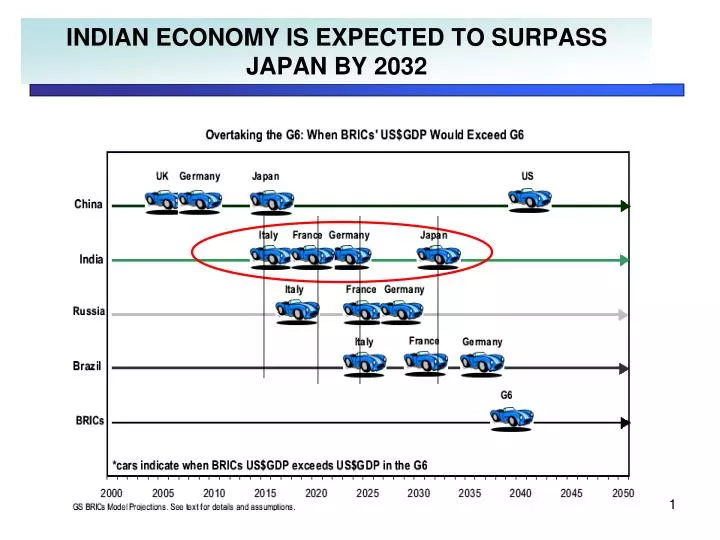
INDIAN ECONOMY IS EXPECTED TO SURPASS JAPAN BY 2032. Ranked 4 th in the world on GDP - Purchasing Power Parity basis, 11 th in absolute terms. (IMF) Second only after China, aspirational 10 % growth looks possible Continuously improving macro economic factors

E N D
Ranked 4th in the world on GDP - Purchasing Power Parity basis, 11th in absolute terms. (IMF) Second only after China, aspirational 10 % growth looks possible Continuously improving macro economic factors A strong demographic profile : with a large consumer base Growing urbanization Stable social and political environment IN SUMMARY THE FUTURE IS UPBEAT
.. INVESTMENT IN INFRASTRUCTURE SEGMENT PROJECTED INVESTMENT Till 2012 by Committee on Infrastructure India has potential to absorb US $ 150 billion in next five years in the infrastructure sector alone. The tenth plan investment in infrastructure has been revised to Rs. 11,088 Billion from earlier 10,894 Billion during mid term appraisal.
WHILE AUTOMOTIVE WOULD REGISTER THE HIGHEST GROWTH PV – Passenger Vehicle CV – Commercial Vehicle CAGR 15 % CAGR 7 % • Government focus on infrastructure & Roads • Availability of consumer finance at low interest rates • Excise Duty reduction & Tax SOP’s by government to boost demand • Higher disposable income – Double working households on the rise
THUS SIGNIFICANT CAPACITIES ARE EXPECTED IN THE MEDIUM TERM Both by Capacity Expansion by existing players * . . . . New Entrants with the Greenfield projects… and * Incl their Greenfield Projects Capacity Addition projected : ~ 50 Mill T in next decade.
BEING INHERENTLY COMPETITIVE…. • Abundant Natural resources • Human Resources • Strategic Location COST OF PRODN OF HRB (USD/MT)
INDIA WOULD EMERGE AS A GLOBAL HUB India to play the Key role in Steel Market dynamics
The economic indicators are all favorable for Growth. IN SUMMARY.. • Indian steel industry exudes optimism • Investment in infrastructure is crucial to step up demand for steel. • Supply may have to be rationalized in line with the demand (Dom + exports) • Integrated Mills would hold the key in future growth of Indian Steel supplies. • New technologies to use indigenous natural resources would have to be developed.
Summary • India will become the fastest growing economy out of 34 developed and emerging markets and 3rd larget economy by 2020. • Current GDP per capita is USD 2500 and expected to be USD 5000 in 2020. • Poverty ratio dropped from 50% of population in 1950 to 26% in 2005. • Economic growth rose from 3.7% in 50s & 60s to +6% in 1980s. • Current population growth rate of 1.5% to decrease to 1.3% in 2020.
Summary • Household savings rate to increase to 30% from current 23%. • About 100,000 MW new capacity (90% of present) will be added in power sector in next 7 years. This should also act as strong driver of steel growth. • The Fiscal Responsibility and Budget Management Act, 2002 binds fiscal managers to specific deficit targets each year with a goal to bring down the total deficit and revenue deficit to 3% and 0% of the GDP by 2008-09.
Summary • Literacy standards in 1951 was 18% and currently it is 65%. • FDI inflow is 0.5% of GDP (USD 3 bn) in recent years as compared to 4% of GDP for China (USD 45 bn) • One of the lowest electricity consumption at 365 units per capita as compared to 893 in China and 1729 in Brazil.
The Global Economic Forecast: Asia poised to be the emerging power house of growth • In 2020, the US and China will still be the two largest economies in the world (in PPP) • India leaves Japan behind and moves up to 3rd place • India, Malaysia and China will post the highest GDP growth rates (above 5%) over 2006-20 • Ireland, the US and Spain are the rich countries expected to grow the most
Steel Consumption Vs. GDP S.Korea China Taiwan Japan US India Other Africa Bubble size represents the population The growth in BRIC will double the steel demand by 2050 Source: internal analysis
Growth in key sectors will drive the steel demand UAE – 1252 Apparent Steel consumption of countries > 150 MT, The present gap World Avg. – 170 India – 33 • Key Sectors driving growth • Infrastructure development • Housing and urban development • High degree of urbanizations • High demand in the auto sector • Capacity building in steel making Only awaiting the right trigger.
Million tons Decade of 1980’s Decade of 1990’s Decade of 2000 Future outlook CAGR = 2.8% CAGR = 10% CAGR = 4.2% CAGR = 2% 1980 1985 1990 1995 2000 2001 2002 2003 2010E 2015E Source: IISI Factbook; McKinsey analysis Global steel demand Global Steel Demand Is Expected To Grow At ~3% Till 2015
Raw Material demand in India to increase by 13% to meet the rise in steel demand • Imperatives for 8% GDP Growth • Manufacturing must grow at 11% • This means a growth of 13% for Mining Industry if it has to contribute 5% to GDP by 2010 instead of 2.5% at present. • 13% growth in mining has to be driven by few lead minerals such as coal, iron ore, supported by other minerals.
Robust growth in infrastructure, power, construction and steel sectors will drive the Steel Demand Construction sector will grow at CAGR of 15%. Source: SSKISept’05 issue Expenditure on Infrastructure Incremental Steel demand for Power Sector In addition there will be investment for additional 25 mt capacity in steel itself by 2010. Potential for steel - 25-30% of the investment cost.
The Early Years The 1st Plateau The 1st Surge The 2nd Plateau The 2nd Surge CAGR 5 % CAGR 5 % CAGR 7 % CAGR 2 % CAGR 1 % Fall of USSR Great Depression WW 2 Oil Crisis Asian Financial Crisis WW 1 Global steel demand poised for robust growth