Download
1 / 19
190 likes | 337 Views
The Indian Economy. A brief analysis by John Birchall. India - an overview. Over 1000 million people Divided into 59 economic centres highest number of IT literate people at post undergraduate level in the world major force in engineering has own space programme

E N D
The Indian Economy A brief analysis by John Birchall
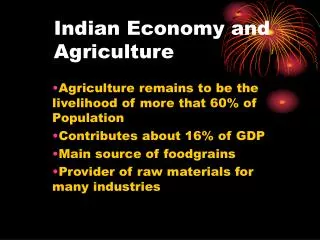
India - an overview • Over 1000 million people • Divided into 59 economic centres • highest number of IT literate people at post undergraduate level in the world • major force in engineering • has own space programme • has own nuclear programme
An overview - 2 • Poverty reduction remains major target • Per capital GNI $450 per annum. • Poverty and illiteracy closely linked, especially amongst women • 34% of young population remain malnourished • 4 - 5 million HIV/Aids cases
Population 1 billion + annual growth 1.8% fertility rate 3.1 infant mortality per 1000 live births = 70 mortality of those under 5 per 1000 live births = 88 Malnutrition prevalence of children under 5 = 45% 30% of people live in urban centres Illiteracy rates - males = 31%, females = 54% India - its people
GDP growth since 1981 is 5.8%, highest amongst large countries outside East Asia Removed strategy of protectionism and growth began to increase Opening-up of markets has seen agriculture grow by 3.3% p.a. during 1990’s major reason for decline in poverty 70% of poor live in rural areas India - a case of steady progress
40% of nations poor live in north and east of country re-focus of agriculture - end of subsidies and open markets being encouraged distortions in agriculture within States The poorest States have high debt ratios Central government has problems with public sector pay awards 34% of population still live in poverty = 300 million India - a case of steady progress -2
30 million children still do not attend school women still not fully engaged in political, legal and economic systems success of women only banks and micro loans Compare with Indonesia - on a par in 1960, now has 80% literacy and <20% below poverty much still dependent on ‘good’ harvest - problems arise when food supply poor India - progress 3
Large Central government fiscal debt is a worry approximately 2% of GDP total Central government debt is 9.6% of GDP This raise external worries regarding fiscal discipline and macro management to cut deficit Central government has raised taxes In contrast to fiscal situation trade is encouraging India progress - 4
Current deficit down to 1% of GDP but exports have slipped as world markets began to tighten tariff reform will ease problems as will expenditure on infrastructure Reform of public-sector dominated financial sector being asked for government debt takes up 40% of bank deposits private sector crowded out? India progress - 5
Privatisation beginning - power thought to be first candidate will reduce public sector debt and interest rate pressure good governance now a major aim De-regulation continuing in agriculture to assist in increasing international competitiveness but much remains to be done India progress - 6
3.3 million sq km = India! 640 of which are covered in forest .1% reduction in forests each year Proportion of population with improved access to water =88% Those with access to improved sanitation = 77% Energy use per capita ( equivalent of kg of oil) = 485 Electricity use per capita (kwh) 347.3 The environment
GNI total $ 473 billion per capita GNI $460 GDP growth 4.5 p.a. Inflation 6.1% p.a. Agriculture value added as percentage of GDP = 24.5% Industry value added = 27.1% Services value added = 48.4% Exports of goods and services as % GDP=13.6% Imports as % GDP = 16.5% Gross Capital formation as %GDP = 13% The economy
Trade in Goods as share of GDP 21% Net barter terms of trade 108 Foreign Direct Investment US$ Net = 2.3 billion Total Debt service ( % of exports) = 12.5% Short-term debt outstanding = 3.5 billion$ Aid per capita(US$) 1.5 Overall budget deficit = 5.4% of GDP The economy - 2
Telephones(fixed and mobile) per 1000 people = 35.5 Personal Computers per 1000 people = 4.5 Internet users 5 million Paved Roads as % of total 20.3% Aircraft departures 198.5 thousand CO2 emissions(metric tons per capita) 1.1 Technology and Infrastructure
Figures not available for • Net secondary attendance • Girls in secondary education • Net primary school attendance • Disability prevalence in both rural and urban areas • Prevalence of HIV/Aids in rural and urban areas
Gems and ornamental items 16.5 Engineering 12.9 Textiles 12.8 Garments 12.1 Chemicals 8.0 Leather goods 5.8 Iron Ore 1.7 Major trade - exports
Registered Medical practitioner per 10,000 = 5.5 Beds per 10,000 = 9.3 Proportion of population dependent on agriculture 78% Birth rate per 1000 26.1, death rate per 1000 8.7% Health and Social Statistics