Download
1 / 18
180 likes | 324 Views
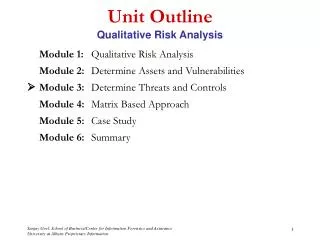
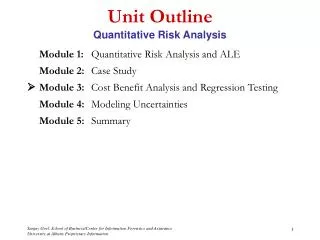
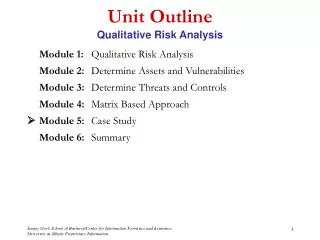
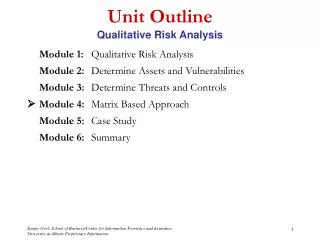
Unit Outline Qualitative Risk Analysis. Module 1: Qualitative Risk Analysis Module 2: Determine Assets and Vulnerabilities Module 3: Determine Threats and Controls Module 4: Matrix Based Approach Module 5: Case Study Module 6: Summary. Module 4 Matrix Based Approach.

E N D
Unit OutlineQualitative Risk Analysis Module 1: Qualitative Risk Analysis Module 2: Determine Assets and Vulnerabilities Module 3:Determine Threats and Controls Module 4: Matrix Based Approach Module 5: Case Study Module 6: Summary
Matrix Based ApproachLearning Objectives • Students should be able to: • Understand how to determine risk posture. • Comprehend a risk aggregation model. • Recognize the need for optimization of risk. • Use the matrix-based approach to determine risk
Matrix-Based ApproachRisk Posture • Individual risks aggregated = Total risk posture • True comparison of relative risks of different organizations • Mathematical approach for aggregation provided • Methodology standardized • Data needs to be customized to organization • Controls can reduce the cost of exposure • Need to determine optimum controls for organization • Methodology for determining controls shown next slide • Analysis should be undertaken to see the impact of new projects on security
Matrix-Based ApproachModel • Let: • A be a vector of loss of an asset where al is the lth asset, s.t., 0 < l < L • V be a vector of vulnerabilities where vk is the kth vulnerability, s.t., 0 < k < K • T be a vector of threats where tj is the jth asset, s.t., 0 < j < J • C be the vector of controls where ci is the ith control, s.t., 0 < i < I • Also Mα be the matrix that defines the impact of vulnerabilities (breach in security) on assets, where, αkl is the impact of kth vulnerability on the lth asset • Also Mβ be the matrix that defines the impact of threats on the vulnerabilities, where, βjk is the impact of jth threat on kth vulnerability • Also Mγ be the matrix that defines the impact of a controls (breach in security) on the threats, where, γij is the impact of ith control on the jth threat The notation is graphically explained in the next few slides
Matrix-Based ApproachModel, cont’d. A (Assets) • Data Collection: • Primary Data from corporations that track financial losses due to different attacks • Secondary Data from the reports of financial loss from organizations like CERT, CSI/FBI and AIG • Data specific to a corporation, could perhaps be classified into different groups of companies akl V (Vulnerabilities) L K • Where akl is the Impact of vulnerability k on given asset l. • i.e. fraction of the asset value that will be lost if the vulnerability is exploited
Matrix-Based ApproachModel, cont’d. V (Vulnerabilities) • Data Collection: • Threat data and frequency of threats is information that is routinely collected in CERT and other such agencies. • Log data and collected data from the organization itself can be another source of information • Data can also be collected via use of automated monitoring tools bjk T (Threats) K J bjk is the probability that threat j will exploit vulnerability k
Matrix-Based ApproachModel, cont’d. T (Threats) • Data Collection: • Approximate control data can be procured from various industry vendors who have done extensive testing with tools. • Other sources of data can be independent agencies which do analysis on tools. gij C (Controls) J I gij is the fraction by which controls reduce the frequency of a threat exploiting a vulnerability
Matrix-Based ApproachModel, cont’d. Then losses if no control exist Then losses if controls exist • = sum = product
Risk AggregationOptimization If ζ is the maximum allocated budget for controls the optimization problem can be formulated as:
Matrix Based ApproachMethodology • Consists of three matrices • Vulnerability Matrix: Links assets to vulnerabilities • Threat Matrix: Links vulnerabilities to threats • Control Matrix: Links threats to the controls • Step 1 • Identify the assets & compute the relative importance of assets • Step 2 • List assets in the columns of the matrix. • List vulnerabilities in the rows within the matrix. • The value row should contain asset values. • Rank the assets based on the impact to the organization. • Compute the aggregate value of relative importance of different vulnerabilities
Matrix Based ApproachMethodology • Step 3 • Add aggregate values of vulnerabilities from vulnerability matrix to the column side of the threat matrix • Identify the threats and add them to the row side of the threat matrix • Determine the relative influence of threats on the vulnerabilities • Compute aggregate values of importance of different threats • Step 4 • Add aggregate values of threats from the threat matrix to the column side of control matrix • Identify the controls and add them to the row side of the control matrix • Compute aggregate values of importance of different controls
Matrix Based ApproachDetermining L/M/H • There needs to be a threshold for determining the correlations within the matrices. For each matrix, the thresholds can be different. This can be done in two ways: • Qualitatively • determined relative to other correlations • e.g. asset1/vulnerability1 (L) is much lower than asset3/vulnerability3 (H) correlation. asset2/vulnerability2 correlation is in-between (M) • Quantitatively • determined by setting limits • e.g. if no correlation (0), if lower than 10% correlation (L), if lower than 35% medium (M), if greater than 35% (H)
Matrix Based ApproachExtension of L/M/H • Although the example provided gives 4 different levels (Not Relevant, Low, Medium, and High), organizations may choose to have more levels for finer grained evaluation. • For example: • Not Relevant (0) • Very Low (1) • Low (2) • Medium-Low (3) • Medium (4) • Medium-High (5) • High (6)
Critical Infrastructure Trade Secrets (IP) Client Secrets Reputation (Trust) Lost Sales/Revenue Cleanup Costs Info/ Integrity Hardware Software Services Web Servers Compute Servers Firewalls Routers Client Nodes Databases Matrix Based ApproachAssets and Vulnerabilities Assets & Costs Scale Not Relevant - 0 Low – 1 Medium – 3 High – 9 Relative Impact • Customize matrix to assets & vulnerabilities applicable to case • Compute cost of each asset and put them in the value row • Determine correlation with vulnerability and asset (L/M/H) • Compute the sum of product of vulnerability & asset values; add to impact column Value Vulnerabilities
Web Servers Compute Servers Firewalls Routers Client Nodes Databases … … … … Denial of Service Spoofing and Masquerading Malicious Code Human Errors Insider Attacks Intrusion … Matrix Based ApproachVulnerabilities and Threats Vulnerabilities Scale Not Relevant - 0 Low– 1 Medium – 3 High – 9 Relative Threat Importance • Complete matrix based on the specific case • Add values from the Impact column of the previous matrix • Determine association between threat and vulnerability • Compute aggregate exposure values by multiplying impact and the associations Value Threats
Denial of Service Spoofing Malicious Code Human Errors Insider Attacks Intrusion Spam Physical Damage … … Firewalls IDS Single Sign-On DMZ Training Network Configuration Security Policy Hardening of Environment Matrix Based ApproachThreats and Controls Threats Value of Control Scale Not Relevant - 0 Low – 1 Medium – 3 High – 9 • Customize matrix based on the specific case • Add values from the relative exposure column of the previous matrix • Determine impact of different controls on different threats • Compute the aggregate value of benefit of each control Value Controls
Matrix-Based ApproachSummary • Many methodologies are available for qualitative risk analysis. • A matrix-based methodology incorporates a model which allows for aggregation of risks. This approach: • Brings transparency to risk analysis process • Provides a comprehensive methodology • Easy to use • Allows organizations to work with partial data • More data can be added as made available • Risk posture can be compared to other organization's • Determines controls needed to improve security