Unit Outline Quantitative Risk Analysis
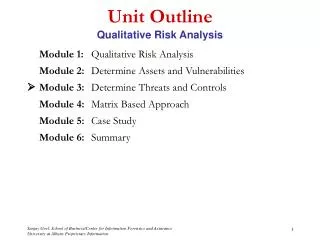
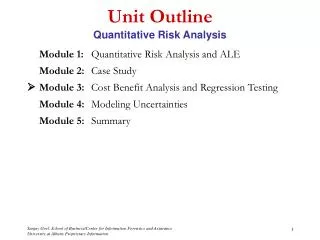
Unit Outline Quantitative Risk Analysis. Module 1: Quantitative Risk Analysis Module 2: Case Study Module 3: Cost Benefit Analysis and Regression Testing Module 4: Modeling Uncertainties Module 5: Summary. Module 1 Quantitative Risk Analysis.

Unit Outline Quantitative Risk Analysis
E N D
Presentation Transcript
Unit OutlineQuantitative Risk Analysis Module 1: Quantitative Risk Analysis Module 2:Case Study Module 3: Cost Benefit Analysis and Regression Testing Module 4: Modeling Uncertainties Module 5: Summary
Quantitative Risk AnalysisLearning Objectives • Students should be able to: • Define quantitative risk analysis • Recognize the steps involved in such a risk analysis • Determine Likelihood of Exploitation • Identify Risk Exposure • Compute Annual Loss Expectancy (ALE)
Quantitative Risk Analysis Risk Analysis Definition • Risk analysis involves the identification and assessment of the levels of risks calculated from the known values of assets and the levels of threats to, and vulnerabilities of, those assets. • It involves the interaction of the following elements: • Assets • Vulnerabilities • Threats • Impacts • Likelihoods • Controls
Quantitative Risk Analysis Risk Analysis Concept Map • Threats exploit system vulnerabilities which expose system assets. • Security controls protect against threats by meeting security requirements established on the basis of asset values. Source: Australian Standard Handbook of Information Security Risk Management – HB231-2000
Quantitative Risk Analysis Definitions • Quantitative risk analysis methods are based on statistical data and compute numerical values of risk • By quantifying risk, we can justify the benefits of spending money to implement controls. • It involves three steps • Estimation of individual risks • Aggregation of risks • Identification of controls to mitigate risk
Quantitative Risk AnalysisRisk Analysis Steps Security risks can be analyzed by the following steps: • Identify and determine the value of assets • Determine vulnerabilities • Estimate likelihood of exploitation • Compute frequency of each attack (with & w/o controls) using statistical data • Compute Annualized Loss Expectancy • Compute exposure of each asset given frequency of attacks • Survey applicable controls and their costs • Perform a cost-benefit analysis • Compare exposure with controls and without controls to determine the optimum control
Quantitative Risk AnalysisDetermining Assets & Vulnerabilities • Identification of Assets and Vulnerabilities is the same for both Qualitative and Quantitative Risk Analysis • The differences in both of these is in terms of valuation: • Qualitative Risk Analysis is more subjective and relative • Quantitative Risk Analysis is based on actual numerical costs and impacts.
Quantitative Risk AnalysisLikelihood of Exploitation • Likelihood relates to the stringency of existing controls • i.e. likelihood that someone or something will evade controls • Several approaches to computing probability of an event • classical, frequency and subjective • Probabilities hard to compute using classical methods • Frequency can be computed by tracking failures that result in security breaches or create new vulnerabilities can be identified • e.g. operating systems can track hardware failures, failed login attempts, changes in the sizes of data files, etc.
Quantitative Risk AnalysisLikelihood of Exploitation • Difficult to obtain frequency of attacks using statistical data. Why? • Data is difficult to obtain & often inaccurate • If automatic tracking is not feasible, expert judgment is used to determine frequency • Approaches • Delphi Approach: Probability in terms of integers (e.g. 1-10) • Normalized: Probability in between 0 (not possible) and 1 (certain)
Quantitative Risk AnalysisDelphi Approach • Subjective probability technique originally devised to deal with public policy decisions • Assumes experts can make informed decisions • Results from several experts analyzed • Estimates are revised until consensus is reached among experts
Quantitative Risk AnalysisRisk Exposure • Risk is usually measured as $ per annum and is quantified by risk exposure. • ALE (Annual Loss Expectancy, expressed as: $/year) • If an event is associated with a loss • LOSS = RISK IMPACT ($) • The probability of an occurrence is in the range of: • 0 (not possible) and 1 (certain) • Quantifying the effects of a risk by multiplying risk impact by risk probability yields risk exposure. • RISK EXPOSURE = RISK IMPACT x RISK PROBABILITY
Quantitative Risk AnalysisIntangible Assets • Incorporating intangible assets within Quantitative Risk Analysis is difficult as it is hard to put a price on things such as trust, reputation, or human life. • However, it is necessary to put an as accurate a value as possible when factoring these assets within risk analysis as they may be even more important than tangible assets.
Quantitative Risk AnalysisComputing ALE • Single Loss Expectancy: Loss to an asset if event occurs • Value of the lost asset = Ci • Impact on the Asset (if event occurs) = Pi • SLE = Ci * Pi • Annualized Rate of Occurrence (ARO) characterizes, on an annualized basis, the frequency with which a threat is expected to occur. • Annualized Loss Expectancy (ALE) computes risk using the probability of an event occurring over one year. • Formulation • ALE = (SLE)(ARO) Source: Handbook of Information Security Management, Micki Krause and Harold F. Tipton
Quantitative Risk AnalysisExample #1: Gym Locker • Scenario: There is a gym locker used by its members to store clothes and other valuables. The lockers cannot be locked, but locks can be purchased. • You need to determine: • Risk exposure for gym members • Controls to reduce risk
Quantitative Risk AnalysisExample #1: Gym Locker, cont’d. • Identify assets and determine value • Clothes $50 • Wallet $100 • Glasses $100 • Sports equipment $30 • Driver’s license $20 • Car keys $100 • House keys $60 • Tapes and walkman $40 ____ • Total Loss/week: $500 • Find vulnerability • Theft • Accidental loss • Disclosure of information (e.g. read wallet) • Vandalism
Quantitative Risk AnalysisExample #1: Gym Locker, cont’d. • 4 (once every four months) • 3 (once a year) • 2 (once every three years) • 1 (less than once every 3 years) • Estimate likelihood of exploitation • 10 (more than once a day) • 9 (once a day) • 7 (once a week) • 6 (once every two weeks) • 5 (once a month) • For theft: estimated likelihood is 7 • Figure annual loss: • ~$500 worth of loss each week • ~52 weeks in a year • ~$26,000 loss per year
Quantitative Risk AnalysisExample #1: Gym Locker, cont’d. • Determine cost of added security • New lock $5 • Replacement for lost key $10 • On average members lose one key twice a month (24 times per year) • Estimate likelihood of exploitation under added security • The new likelihood of theft could be estimated at a 4. • Cost Benefit Analysis • Revised Losses (including cost of controls) = (500 * 4) + (15*24) = 2360 • Net savings = 26000 – 2360 = 23640
Quantitative Risk AnalysisExample #2: Hard Drive Failure • The chance of your hard drive failing is once every three years • Probability = 1/3 • Intrinsic Cost • $300 to buy new disk • Hours of effort to reload OS and software • 10 hours • Hours to re-key assignments from last backup • 4 hours • Pay per hour of effort • $10.00 per hour • Total loss (risk impact) • $300 + 10 x (10+4) = $440 • Annual Loss Expectancy (pa = per annum) • (440 x 1/3)$pa = $147 pa
Quantitative Risk AnalysisExample #3: Virus Attack • Situation: Virus Attack on same system • You frequently swap files with other people, but have no anti-virus software running. • Assume an attack every 6 months (Probability = 2 per year) • No need to buy a new disk • Rebuild effort (10 + 4) hours • Total loss = $10 x (10 + 4) = $140 • ALE = ($140 x 2) $pa = $280 pa
Quantitative Risk AnalysisSummary • Quantitative risk analysis involves statistical data and numerical values and can be used to justify the benefit of controls. • While asset and vulnerability identification are the same for qualitative and quantitative methods, qualitative is more subjective and quantitative is more absolute. • Probabilities can be calculated in multiple ways. This can be done using calculated values or the Delphi Approach (1-10) and a Normalized Approach (1,0), which are more subjective.