Download
1 / 16
160 likes | 761 Views
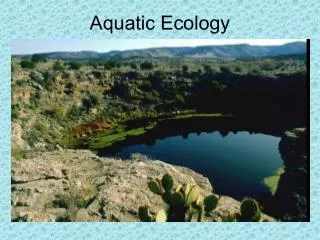
Definition : A fast-moving freshwater ecosystem such as a stream or river. Lotic Aquatic Ecology. Lotic /Stream Habitats: See Handouts The Pool 2. The Riffle/Rapids 3. The Run. Where will you find the greatest biodiversity in a Stream/Lotic Ecosystem?. The Riffles/Rapids Habitat! Why?

E N D
Definition: A fast-moving freshwater ecosystem such as a stream or river. Lotic Aquatic Ecology • Lotic/Stream Habitats: See Handouts • The Pool • 2. The Riffle/Rapids • 3. The Run
Where will you find the greatest biodiversity in a Stream/Lotic Ecosystem? The Riffles/Rapids Habitat! Why? 1. High Oxygen/Slightly Lower Temps.! 2. Stones, rocks and rubble provide shelter! 3. Stones, rocks and rubble trap food particles! 4. Bottom dwellers do not become buried in sediments!
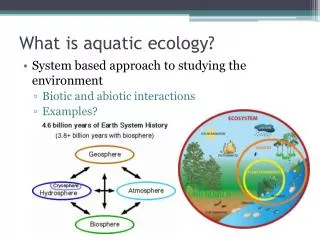
Embeddedness: the extent to which rocks are sunken or covered by mud, sand and silt! This can limit habitat availability! Changes in Lotic Systems: From Source to Sea • The Beginning: Small, Fast, Spring-fed Headwaters • to • 2. Larger Streams • to • 3. Large, Slower Rivers!
Changes in Habitats • Streams Rivers • D.O. Saturated 1. Lower D.O. • Cooler Temps. 2. Warmer Temps. • Production is largely Organic 3. Production is largely Debris Aquatic plants and Phytoplankton • 4. Water levels fluctuate 4. Water levels more stable seasonally • 5. Shallower Water 5. Deeper Water • 6. V-shaped, narrower channel 6. U-shaped, wider channel • 7. Clearer Water 7. More Turbid Water
Food Production in Lotic Ecosystems • Autumn Leaf Fall and Organic Debris from Stormwater • Runoff! • * 75% of yearly food production! • * Each Stream has it’s own specific “Watershed Tea”! • How do migratory fish find their way back to the streams • they were born in? • 2. Phytoplankton, attached algae and aquatic plants in the pool • area! • *25% of yearly food production! • 3. See handouts on Nutrient Spiraling and Food Pyramids!
ConsumerNiches in Lotic Sytems • Major feeding groups of Aquatic Insects: See Handout! • Shredders (SH): Feed on large pieces of live or dead plant • material. • Can be Herbivores or Detritivores! • Ex: Cranefly Larvae • Collectors: Feed on fine or small particles of organic matter • in the water. They are Detritivores! • Filter Collectors (FC) ex: Black Fly Larvae • Collector Gatherers (CG) ex: Mayflies
Scrapers (SC): Feed on algae or fine organic debris • attached to rocks and other surfaces. • AKA = Grazers! ex: Water Pennies • Piercers: Piercing mouth parts to suck nutrients from plants/animals! • Can be herbivores/carnivores. • Ex: Water Striders and Water Boatmen • Predators/Engulfers: Carnivores such as Dragonfly • Larvae or Hellgrammites.
Introduction to Stream Macroinvertebrates What is the most reliable method to use to judge the water quality of a stream or river? a) Chemical/Physical Testing? or b) Biological Assessment? *National Medal of Science: Dr. Ruth Patrick, Academy of Natural Science and the Stroud Water Research Center.
The Answer: Biological Assessment! Because: a) The water in a Lotic System is constantly moving and changing at a fast pace. The chemical test results that you obtain now can change anytime in the future! b) The biological community in a stream must be able to survive the water conditions all year round. Their presence or absence is a Strong indicator of water quality!
What is a macroinvertebrate? • A small organism without a backbone that is still large • enough to be seen with our eyes. • Ex: aquatic insects, crustaceans, arachnids, mollusks, worms. How are organisms classified? • Kingdom ex: Animalia • Phylum ex: Chordata • Class ex: Mammalia • *Order ex: Primates • *Family ex: Hominidae • Genus ex: Homo • Species ex: sapiens
Insect Metamorphosis or Life Cycles (see Handout) 1. Incomplete Metamorphosis Egg larval Stage (nymph, instar, niad) Adult 2. Complete Metamorphosis Egg larval Stage pupa Adult Ex: Mayfly Life Cycle – See Handout!
Macroinvertebrate Pollution Tolerance Levels Class I Taxa: Pollution Intolerant Class II Taxa: Moderate Pollution Tolerance Level Class III Taxa: Pollution Tolerant *See handouts, Web Site NYS D.E.C. Adaptations of Lotic Organisms: *See Handouts on Adaptations, Nat’l Geo “Unseen Life in a Mountain Stream” and Slide Show on “Schuylkill River Ecology”
Assessment of Stream Ecology and Water Quality EPA Methods • Key elements of a stream study: • Biological Conditions • Macroinvertebrate Sampling and Biometric Analysis • Chemical Conditions • Dissolved oxygen, nitrates, phosphorus, pH, etc. • Physical Conditions • Watershed Survey and Habitat Assessment • Stream Flow Study
Rationale for each type of Biological Assessment • Simple Water Quality Score • Analysis based upon relative #’s of Class I, II and III • macroinvertebrates. • Identification by Order. • Biometric Macroinvertebrate Data Analysis • (All of the following depend upon identification by Family) • Number of Taxa / Taxa Richness is the total number • of different taxa or families found in a sample. • Greater Biodiversity = Better Water Quality • Number of EPT Taxa / EPT Richness is the total • number of generally pollution intolerant families; • Stoneflies, Mayflies and Caddisflies. • Greater EPT Diversity = Better Water Quality
Percent Dominance is the percent composition of the • Dominant family found in the sample. • Lower % of dominance = Better Biodiversity and Better • Water Quality • The Sensitive Taxa Index is an accurate mathematical index • based upon family level tolerance. (0 = Most Intolerant, • 10 = Most Tolerant) How does it work • 1. Multiply the # of taxa in each family by it’s pollution • tolerance value. • 2. Add all of the obtained values and divide by the total • number of individuals sampled. • Σ ( Xi t )Σ = summation of xit • n xi = # of individuals in each taxa • t = the tolerance value • n = the # of individuals sampled
Percent Abundance of Scrapers / Grazers ( Algae Eaters) • The # of scrapers and grazers divided by the total # of • Individuals sampled. • A high percentage of scrapers and grazers is an indicator of • Better water quality. • PercentAbundance of Shredders • (Leaf Litter/Plant Debris Eaters) • The # of shredders divided by the total # of individuals • sampled. • A high percentage of shredders is an indicator of better • water quality.