Download
1 / 21
210 likes | 337 Views
This study explores global networks of functional coupling in eukaryotes through comprehensive data integration. It introduces FunCoup, an online interactome resource, allowing analysis of species-specific and cancer-specific networks leveraging expression, methylation, and mutation data. Using state-of-the-art methods such as reverse engineering and frequency analysis of somatic mutations, the research investigates complex relationships between gene networks, alterations in cancer, and pathway characterizations. Insights into driver mutations and network enrichment analyses further enhance our understanding of biological interactions in health and disease.

E N D
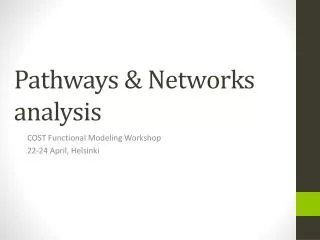
Functional analysis with pathways and networks AndreyAlexeyenko andrej.alekseenko@scilifelab.se
FunCoup: on-line interactome resource http://FunCoup.sbc.su.se Andrey Alexeyenkoand Erik L.L. Sonnhammer (2009) Global networks of functional coupling in eukaryotes from comprehensive data integration.Genome Research.
Species-specific networks:evolutionary conservation Mousevs. human
Cancer-specific networks:links inferred from expression, methylation, mutations Functional coupling transcription transcription transcription methylation methylation methylation mutation methylation mutation transcription mutation mutation + mutated gene State-of-the-art method to beat: Reverse engeneeringfroma single source (usually transcriptome)
State-of-the-art method to beat: Frequency analysis of somatic mutations Do gene networks tell the story? • Yellow diamonds: somatic mutations in prostate cancer • Pink crosses: also mutated in glioblastome (TCGA)
Network analysis made statistically sound:compared to a reference and quantified Actual network: observed pattern A random pattern N links_real= 12 Question: Is ANXA2 related to TGFbeta signaling? N links_expected = 4.65 Standard deviation = 1.84 Z = (N links_observed – N links_expected) / SD = 3.98 P-value = 0.0000344 FDR < 0.1
Network enrichment analysis: what is the reference?We refer to a randomized network: preserves topology, lost biology • Link swapping (Perl): (original algorithm by Maslov & Sneppen, 2003) – work with Simon Merid. • De novo network generation (C++): work with T. McCormack, O. Frings, E. Sonnhammer. • Matrix permutation (R): work with Woojoo Lee, YudiPawitan.
Biological analysis of differential expression State-of-the-art method to beat: Gene set enrichment analysis Our alternative: Network enrichment analysis Altered genes Functional set ?
Network enrichment analysis: applications State-of-the-art method to beat: Observational science Pathway characterization Detection of driver mutations Coherence of genome alterations Question: Could copy number alteration in EHR in HOU501106 lead to changes of its transcriptome and proteome? Question: Does gene expression in MAT230414 relate to “response to tumor cell”? Question: Are CNA in HOU501106 coherent? N links_real= 6 N links_real= 55 N links_real= 0 N links_expected = 1.00 N links_expected = 37.05 N links_expected = 1.05 Standard deviation = 1.25 Standard deviation = 3.59 Standard deviation = 0.80 Z = 3.97 Z = 3.59 Z = -1.31 P-value = 0.0000356 P-value = 0.00016 P-value = 0.905
Analysis of cancer-specific wiring • Pathway network of normal vs. tumor tissues • Edges connect pathways given a higher (N>9;p0<0.01; pFDR<0.20) number of gene-gene links (pfc>0.5) between them (seen as edge labels). • Known pathways (circles) are classified as: • signaling, • metabolic, • cancer, • other disease. • Blue lines: evidence from mRNA co-expression under normal conditions + ALL human & mouse data. • Red lines: evidence frommRNA co-expression in expO tumor samples + ALL human data + mouse PPI. • Node size: number of pathway members in the network. • Edge opacity: p0. • Edge thickness: number of gene-gene links.
Arrow of time: network prospective(work with J. Meyer, Duke Univ.) Question: Routes of embryonic intoxication in fish? Answer: through cytochrome P4501A, calcium and iron metabolism, neuronal and retinal development Alexeyenko et al. Dynamic zebrafishinteractome reveals transcriptional mechanisms of dioxin toxicity PLoS One. 2010
Validation of candidate disease genes(work with Jonathan Prince, MEB, KI) Genetic association of sequence variants near AGER/NOTCH4 and dementia. Bennet AM, Reynolds CA, Eriksson UK, Hong MG, Blennow K, Gatz M, Alexeyenko A, Pedersen NL, Prince JA. J Alzheimers Dis. 2011;24(3):475-84. Genome-wide pathway analysis implicates intracellular transmembrane protein transport in Alzheimer disease. Hong MG, Alexeyenko A, Lambert JC, Amouyel P, Prince JA. J Hum Genet. 2010 Oct;55(10):707-9. Epub 2010 Jul 29. Analysis of lipid pathway genes indicates association of sequence variation near SREBF1/TOM1L2/ATPAF2 with dementia risk. Reynolds CA, Hong MG, Eriksson UK, Blennow K, Wiklund F, Johansson B, Malmberg B, Berg S, Alexeyenko A, Grönberg H, Gatz M, Pedersen NL, Prince JA. Hum Mol Genet. 2010 May 15;19(10):2068-78. Epub 2010 Feb 18. Question: Is there extra evidence for GWAS-candidates to be involved? Answer: Yes, for some…
Mutations accumulated in somatic genomes of cancer cell lines(work with Pelin Akan, Joakim Lundeberg) Question: Do mutations within a cancer genome behave like a quasi-pathway? Answer: Yes. Question: How similar are mutation patterns in different cancers? Answer: A lot, but only for drivers and at the pathway level.
Pathway view on the set of toxicity-associated alleles Red node: list of top 50 genes with most contrast allele patterns Grey node: negative control list Yellow: enriched/depleted pathways Edge width: no. of gene-gene links in the network Edge opacity: confidence Green edges: enrichment Red edges: depletion Edges produced by less than 3 list genes are not shown The analysis detected more significantly enriched pathways than for the negative control gene sets of the same size (215 vs. 139; p0 < 0.001; FDR<0.05). More specifically, many thus found pathways were associated with cancer, apoptosis, cell division etc.
Experimental perturbations of syndecan-1 in cancer cells(work with T. Szatmari, K. Dobra, KI Huddinge) Question: Second-order downstream targets of syndecan modulation? Answer: Segments of cell cycle etc. Lines: Red: depletion Blue: enrichment
Network analysis:what’s in it for you? • Prioritization among multiple “technical positives” • Generalization “genes => pathways”, hence new, lower, dimension • Analysis of individual genes “as if” pathways • Testing biological hypotheses, validation • Modular part of high-throughput analytic pipelines
Network analysis:how to succeed? • Analyze prioritized candidates (from genotyping, DE, GWAS…) rather than any genes. • Do not lean on single “interesting” network links. Employ statistics! i.e. “concrete questions” => “testable hypotheses” => “concrete answers” The amount of information in known gene networks is enormous. Let’s just use it!
Erik Sonnhammer’s bioinformatics group Acknowledgements: Erik Sonnhammer, Thomas Schmitt, Oliver Frings, Andreas Tjärnberg, Dimitri Guala, Mun-Gwan Hong, Jonathan Prince, Rochellys Diaz Heijtz, Angelo de Milito, Meng Chen, SiminMerid, YudiPawitan, Woojoo Lee, Erik Aurell, Joakim Lundeberg, Pelin Akan, Joel Meyer, Katalin Dobra, TundeSzatmari, SerhiySouchelnytskyi, IngemarErnberg, KICancer http://FunCoup.sbc.su.se
Gene network discovery:getting rid of spurious links 0.7 0.5 0.4 Data processing inequality: “Direct links convey more information than indirect ones” PCIT algorithm: Partial Correlation & Information Theory