Analyzing Ages and Central Tendency in AMA Supercross Race Data
360 likes | 487 Views
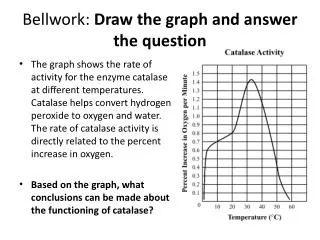
This lesson focuses on analyzing the ages of AMA Supercross race participants, involving tasks such as ordering age data, creating stem-and-leaf and line plots, and determining central tendencies like mean, median, and mode. Students will explore key statistical concepts such as range and outliers while answering essential questions about data analysis. Activities include calculating ages over 20, comparing measurements of central tendency, and applying these concepts using interactive tools. A video resource reinforces learning on central tendency and variability.

Analyzing Ages and Central Tendency in AMA Supercross Race Data
E N D
Presentation Transcript
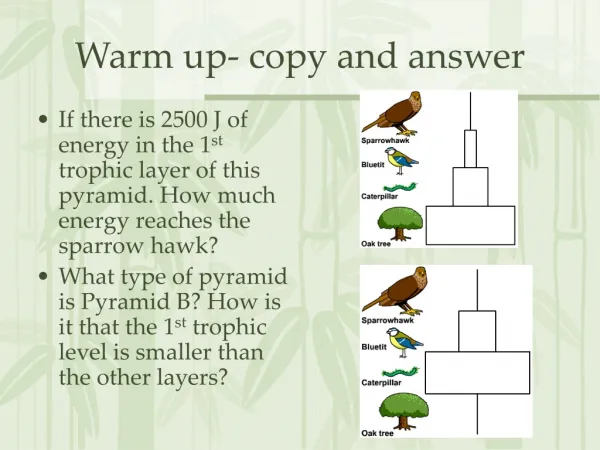
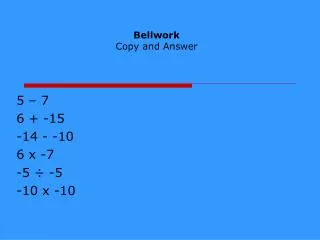
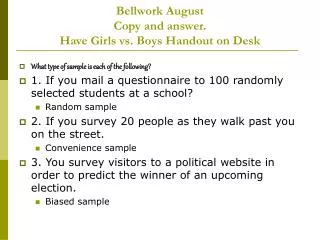
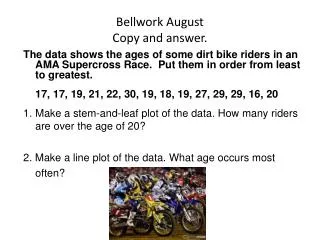
Bellwork August Copy and answer. • The data shows the ages of some dirt bike riders in an AMA Supercross Race. Put them in order from least to greatest. • 17, 17, 19, 21, 22, 30, 19, 18, 19, 27, 29, 29, 16, 20 • Make a stem-and-leaf plot of the data. How many riders are over the age of 20? • 2. Make a line plot of the data. What age occurs most often?
Unit 1 Chapter 7 Section 2 Pg. 381 Mean, Median, Mode, and Range with and without Outliers
Essential Questions: • How does finding the measure of central tendency help in analyzing data? • What is central tendency?
Mean, Mode, and Median http://www.youtube.com/watch?v=FDzwnoXZQZY
Definitions • range: the difference between the highest and lowest numbers in the set of data • mean: the average number of the set of data • median: the middle number in a set of data after the numbers are arranged in order from least to greatest • mode: the number that occurs the most in a set of data
10 12 14 16 18 20 22 24 26 28 30 32 34 36 38 40 42 Definitions continued… • outlier: a number that is much smaller or much larger than the set of data 35, 38, 27, 12, 30, 41, 31, 35 x x x x x x x x
Babe Ruth Central Tendency and Variability Video Clip (3:45) http://player.discoveryeducation.com/index.cfm?guidAssetId=a87b1f07-3e9e-4934-a26d-18125db4ea72 Write down 3 facts about Central Tendency.
Range!How to find the range: 1. Arrange the numbers in ascending order 2. Pick out the smallest number and the largest number. 3. Subtract the two numbers.
Example 1: Find the range of the data set. 4, 7, 8, 2, 1, 2, 4, 2 1, 2, 2, 2, 4, 4, 7, 8 8 – 1 = 7
ACTIVITY 1 • Using interlocking number cubes, make 3 towers. • 6 • 4 • 8 • Now, figure out how to make them all the same length.
Activity 1, ctd. • If you moved two cubes from the tallest tower and added them to the smallest tower, now how long are all three towers? • 6 • This is the MEAN. The mean of {8, 4, 6} is 6.
Activity 2 • Let’s find Mean another way. • Data Set { 1, 3, 5, 9} • Use interlocking cubes to make a tower for each number.
Activity 2, ctd. • Step 1: Find the SUM • Combine all the cubes from all the towers to add. • How many are their total? • Step 2: Divide • There were originally 4 towers, so divide the cubes into four EQUAL groups. • How many cubes are in each group? • This is your MEAN.
How do you find the mean? 1. Add all the numbers together to get the sum 2. Divide the sum by the number of items in the data set. SIT DOWN! GET QUIET! NO GUM! ZERO FOR YOU! Mr. Grumpy Today’s Assignment: Find the mean of: 2, 7, 9, 15, 12
sum 8 items Example 2: Find the mean of the following data set. 6, 4, 3, 5, 2, 5, 1, 8 6 + 4 + 3 + 5 + 2 + 5 + 1 + 8 = 34 = 34 8 4.25
Mean Practice • Complete the ‘No Rest for the Weary’ WS • Show all work on a separate sheet of paper.
How to find the mode? Search to find the number that occurs the most. Sometimes it could be more than one number.
Example 3: Find the mode of the data set. 4, 7, 8, 2, 1, 2, 4, 2 1, 2, 2, 2, 4, 4, 7, 8
Activity 3 • Name Lengths/Singers of Bands • Using the worksheet provided by your teacher, we will cut strips of paper and fold them in half to represent the MEDIAN.
How to find the median? 1. Arrange the numbers in order from least to greatest. 2. Count until you find the middle number. If you have one number, then you have found the answer. If you have two numbers, then continue to step 3. 3. Add the two numbers together, then divide by 2 Median or middle of the street
Example 4: Find the median of the data set. 4, 7, 8, 2, 1, 2, 4, 2 1, 2, 2, 2, 4, 4, 7, 8 2 + 4 = 6 6 2 = 3
Example 5: Find the median of the following data set. 6, 4, 3, 5, 2, 5, 1, 8 1, 2, 3, 4, 5, 5, 6, 8 4 + 5 = 9 9 2 = 4.5
Mean, Median, and ModeBrain-Pop Write down 2 facts about mean, median, and mode from the clip.
Work Session • Find the mean, median, and mode for each problem on the handout. • Show all work. • Remember the following: • Mean: add up all of the numbers and divide them by how ever many numbers are in the data set • Median: put the numbers in order from least to greatest and then find the number in the middle • Mode: the number that occurs the most
10 20 30 40 50 60 70 Example 6: (Word Problem) The line plot shows the number of dollars each of the 10 members of the cheerleading team raised in a week. Which measure of central tendency best describes this data? Justify your answer. XXXX XX XX X X 330 10 15 + 15 + 15 + 15 + 20 + 20 + 40 + 60 + 60 + 70 10 = = 33 The mode is 15. The mode focuses on one data value and does not describe the data set. The median is 20. The median best describes the data set because it is closest to the amount most cheerleaders raised. Most of the cheerleaders raised less than $33, so the mean does not describe the data set.
Outliers (9:56) http://player.discoveryeducation.com/index.cfm?guidAssetId=4D5934D9-3890-4983-A918-11B91F11C2AA&blnFromSearch=1&productcode=US Write down 3 facts about outliers.
mean: median: mode: Example 7: The data shows Sara’s scores for the last 5 math tests: 88, 90, 55, 94, and 89. Identify the outlier in the data set. Then determine how the outlier affects the mean, median, and mode of the data. Then tell which measure of central tendency best describes the data with the outlier. 55, 88, 89, 90, 94 outlier 55 There is no mode. = 416 55+88+89+90+94 55, 88, 89, 90, 94 416 5 = 83.2 The median is 89. The mean is 83.2. With the Outlier
mean: median: mode: Example 7: The data shows Sara’s scores for the last 5 math tests: 88, 90, 55, 94, and 89. Identify the outlier in the data set. Then determine how the outlier affects the mean, median, and mode of the data. Then tell which measure of central tendency best describes the data with the outlier. outlier 55 55, 88, 89, 90, 94 88+89+90+94 = 361 88, 89, 90, 94 + There is no mode. 361 4 = 90.25 2 = 89.5 The mean is 90.25. The median is 89.5. Without the Outlier
Compare data with & without data With the Outlier The mean is 83.2. The median is 89. There is no mode. Without the Outlier The mean is 90.25. The median is 89.5. There is no mode. The mean between the two are 7.05. The median changes .5. Taking out the outlier only changes the mean dramatically.
Possible Activities • See the next few slides
Mean, Median, Mode, Range and Outliers with M&Ms • Open your bag of M&Ms. • Count how many M&Ms are in your bag (DO NOT EAT ANY YET) • We will compare how many M&Ms are in the bags of of your classmates. • Fill in your chart.
Find the mean, median, and mode of the number of M&Ms in the bags. • Are there any outliers? • What is the range?