Download
1 / 16
160 likes | 179 Views
Learn about ecological succession, differentiate primary and secondary succession, explore population characteristics such as geographic distribution, density, and growth rate.

E N D
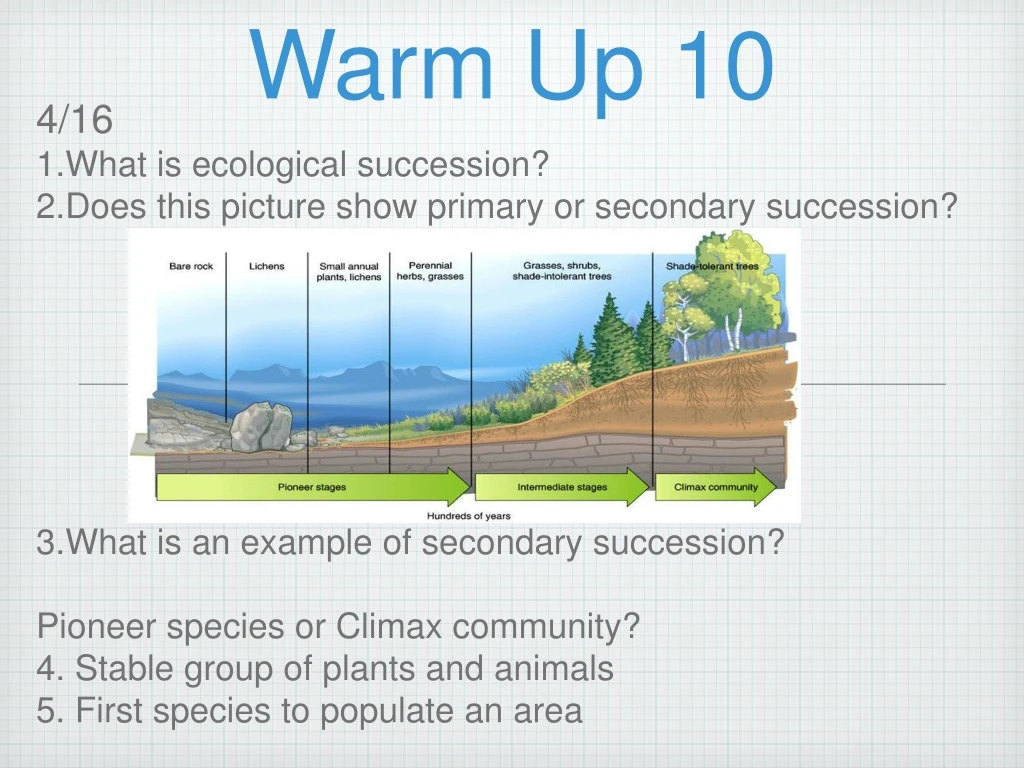
Warm Up 10 • 4/16 • What is ecological succession? • Does this picture show primary or secondary succession? • What is an example of secondary succession? • Pioneer species or Climax community? • 4. Stable group of plants and animals • 5. First species to populate an area
CA State Standard • Students know how fluctuations in population size in an ecosystem are determined by the relative rates of birth, immigration, emigration, and death.
3 Characteristics of Population • Geographic distribution • Density • Growth rate Exponential Growth Logistic Growth
Geographic Distribution • area inhabited by a population • range can vary • few cubic centimeters to square kilometers
Population Density • # of individuals per unit area • EX: 15 squirrels at UCLA Campus
GrowthRate • Population can increase or decrease • Caused by: • # of births • # of deaths • # of individuals that enter or leave population (immigration & emigration)
Growth Rate • Birthrate > death rate = increase • Death rate > birthrate = decrease • Immigration & Emigration
Exponential Growth • When a population reproduces at a constant rate • Unlimited resources • Bacteria reproduce every 20 minutes! • Thats 4,720,000,000,000,000,000,000 in one day!! • Use J-Shape graph
Logistic Growth • Growth slows or stops following period of exponential growth • Resource becomes limited • S shape graph • Eventually reach carrying capacity- • largest # of individuals population can hold
1. When the birthrate of a population exceeds its death rate, the population • A. decreases. • B. increases. • C. stays the same. • increases then decreases.
2. An S-shaped curve on a graph of population growth is characteristic of • A. exponential growth. • B. logistic growth. • C. carrying capacity. • D. delayed growth.
3. What are the 2 ways population can decrease? • Immigration and emigration • Increased death rate and immigration • Decreased birthrate and emigration • Emigration and increased birthrate
3. What is the largest number of individuals an environment can support called? • A. Emigration • B. Immigration • C. Logistic Growth • D. Carrying Capacity
# of individuals in an unit area • a. Geographic Distribution • b. Population Density • c. Growth Rate • d. Distribution Range