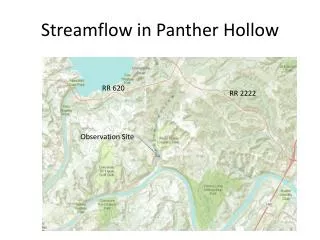
Streamflow Information in Texas
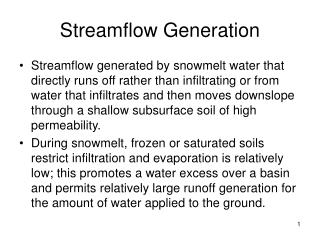
Streamflow Information in Texas. David R. Maidment Director, Center for Research in Water Resources University of Texas at Austin USGS Workshop, Fort Worth, Tx, 9 February 2005. Streamflow Information in Texas. Texas as part of the National Streamflow Information Program

Streamflow Information in Texas
E N D
Presentation Transcript
Streamflow Information in Texas David R. Maidment Director, Center for Research in Water Resources University of Texas at Austin USGS Workshop, Fort Worth, Tx, 9 February 2005
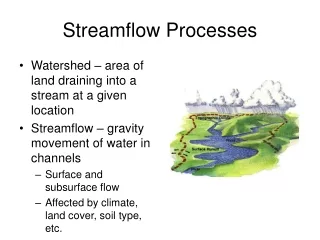
Streamflow Information in Texas • Texas as part of the National Streamflow Information Program • Gage network analysis in Texas • Streamflow information system
Streamflow Information in Texas • Texas as part of the National Streamflow Information Program • Gage network analysis in Texas • Streamflow information system
National Streamflow Information Program • What gages need to be federally supported? • Five goals with associated GIS metrics • Recent National Academy report National Academy Press http://www.nap.edu
NSIP Goals • Interstate and International Waters (Borders and Compacts) • Flood Forecasts (NWS sites) • River Basin Outflows (Water Budgets) • Sentinel Watersheds (Regionalization and Long Term Trends of “natural flows”) • Water Quality (NAQWA, NASQAN,…
Interstate and International Waters(515 gage sites) • Metric: Operate a discharge station at rivers: • on or near crossings of state and international borders where the drainage area of the river reach is greater than 500 square miles, • or where the location is mandated by a treaty, compact or decree
2. NWS Forecast Points (3244 Gage sites) Metric: Operate a streamgaging station at each NWS and NRCS forecast point that is not located on a reservoir
3.River Basin Outflows(450 gage sites) Metric: Operate streamgaging stations near the terminus of each of the 352 Hydrologic Accounting Units (6-digit HUC’s) for water budgeting purposes
4. Sentinel Watersheds (874 Gage sites) Ecoregion Regionalization and Long Term Trends in Streamflow (stations measuring natural flow in undisturbed lands)
5. Water Quality (210 gage sites) Metric: Locate a stream gage on the same river reach as a permanent water quality monitoring site
Source of NSIP Gage Sites • Active USGS gages 2796 (63%) • Other agency gages 307 (7%) • Inactive gages 837 (19%) • New gages 484 (11%) 3103 existing gages (70%) 1221 inactive or new gages (30%)
Number of NSIP Gage Sites Rhode Island (2) Delaware (4) Kansas (166) Colorado (171) California (201) Texas (416)
Streamflow Information in Texas • Texas as part of the National Streamflow Information Program • Gage network analysis in Texas • Streamflow information system
200 300 400 Stream Gages in Texas Peak Flows Daily Mean Flows 1970 1900 1920 1930 1940 1950 1960 1980 1990 1910
Back to 1962 Existing: 312 daily stations, 17 annual peak stations 1962 1970 1900 1920 1930 1940 1950 1960 1980 1990 1910
NSIP Goals vs Existing Stations NSIP Goal: 416 daily stations Existing: 312 daily stations, 17 annual peak stations 1970 1900 1920 1930 1940 1950 1960 1980 1990 1910
Texas Stream Gaging Network Active Stations Discontinued Stations
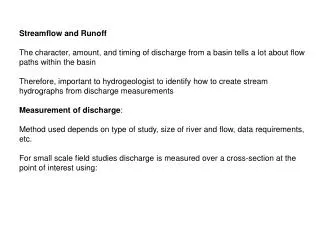
Texas Gage Network Assessment • Carried out by USGS and Texas Water Development Board (principal local cooperator) • Goals • Regionalization – estimate flows or flow characteristics at ungaged sites in 11 hydrologically similar regions • Major Flow – obtain flow rates and volumes in large streams • Outflow from the State – account for streamflow leaving the State • Streamflow conditions assessment – assess current conditions with regard to long-term data and define temporal trends in flow
Regional Optimization Model • Based on Generalized Least Squares Regression – separates model error from error due to finite sample size • Estimating mean annual flow and 25 year peak flow using basin characteristics with equations for each hydrologic region • Three planning horizons (5yr, 10yr, 20yr) • Active or discontinued stations in natural watersheds considered • Start with all stations then step backwards, eliminating least informative station at each step
Estimating the 25-year Peak Streamflow 5yr 5yr 10yr 10yr 20yr 20yr Mean Sampling Error 5yr 10yr 20yr • As number of stations increases, sampling error decreases until a minimum is reached • As planning horizon increases, sampling error decreases Number of Stations
Results of Regional Optimization • Stations on steepest part of the curve offer the most valuable regional hydrologic information relative to basin characteristics • Sampling error increases as you go west and climate gets drier • Mean annual flow 6.6% to 114.3% • 25yr peak flow 9.9% to 28.5% • Much less error in regression equations for 25yr peak flow than mean annual flow in arid regions • Greater variability in error between regions than by adding stations within a region
Flow Correlations • Strong correlation in flows for upstream and downstream stations on the same river • 61 of 81 station pairs analyzed for mean annual flow have correlation coefficient > 0.9 • 43 of 129 station pairs analyzed for 25 year flow have correlation coefficient > 0.9 • Select stations for core network that are not highly correlated with other selected stations
Correlation Coefficient > 0.95 0.9 – 0.95 < 0.9 Interstation Correlation of Mean Annual Flow
Correlation Coefficient > 0.95 0.9 – 0.95 < 0.9 Interstation Correlation of 25yr Peak Flow Figure 12
Results of Texas Study • Proposed core networkof 263 stations for regional hydrology purposes in natural watersheds • 205 active stations (78%) • NSIP for Texas requires 416 stations • Border (10), NWS (345), Basin (36), Sentinel (87), Water Quality (16) (some gages serve multiple goals) • Existing Gage Network of 312 stations • Difficult to make comparisons between national and regional studies because criteria are different
Streamflow Information in Texas • Texas as part of the National Streamflow Information Program • Gage network analysis in Texas • Streamflow information system
Streamflow Information System “The stream gaging activity is no longer considered a network of observation points, but rather an information system in which data are provided by both observation and synthesis” (Fontaine et al, 1984, “Cost Effectiveness of the Stream-Gaging Program in Maine”, USGS Water Supply Paper 2244)
Streamflow Information in Space and Time Current Future Possibilities Time Real Time data Historical daily mean discharge Streamstats Streamflow statistics At Gages Anywhere on a Stream Space
Numerical Weather Prediction(North American Regional Reanalysis) Precipitation Evaporation 3 hour time steps, 32 km grid, 1979 -- 2003
Real-time bacteria estimation Kansas River at DeSoto, KS
Gage Point Design Model Site gages so as to accurately measure the vertical flux (e.g. precipitation) over a domain Domain
Coverage Design Model Take a space and subdivide it into subspaces with an area for each point e.g. service areas of fire stations (goal of 4 min response time to a call)
Coverages of the Guadalupe Basin NWS forecast Watersheds (flooding) Guadalupe HydroNetwork EPA TMDL Segments (water quality) TCEQ water availability points (water supply)
San Marcos basin as a coverage model 1 2 3 4 5 6
Senate Bill 2 in 2001 Texas Legislature authorizes legal protection of instream flow Study program on selected reaches underway Review by National Academy Instream Flows in Texas Report released Feb 8, 2005
Senate Bill 2 • Implementation is joint responsibility of TWDB, TPWD, TCEQ • SB2 says: “… conduct studies and analyses to determine appropriate…flow conditions [that]…support a sound ecological environment.” • Achieving this goal is scientific and institutional challenge for Texas
Instream Flow Studies • Requires TPWD, TWDB, TCEQ to develop procedures for defining instream flow requirements • Implemented on priority study regions by 2010 • Based on aquatic life analysis Trinity Brazos Sabine Guadalupe San Antonio Priority Study Regions
Criterion Depth & velocity Species groups Habitat Hydrodynamic Habitat SMS/RMA2 Data Collection and some statistics Model Model Descriptions ArcGIS Instream Flow DecisionMaking Combining Flows and Biology
Biological Gage • A representative reach associated with a stream gage • Regular monitoring for aquatic life assessment • Scientific program for relating flow and ecological integrity
National: number of stream gages steady, real-time rising Texas: number of stream gages declining since peak of ~410 in 1972 Losing 6 gages per year to less than 290 currently Conclusions National Texas
Texas Needs 416 gages to meet national needs Texas (416)
Correlation Coefficient > 0.95 0.9 – 0.95 < 0.9 Statistical studies have been done to optimize existing gage network