Download
1 / 38
380 likes | 555 Views
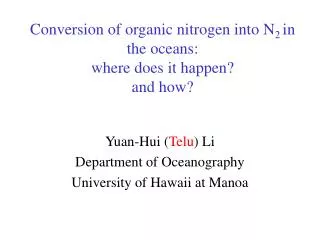
Conversion of organic nitrogen into N 2 in the oceans: where does it happen? and how?. Yuan-Hui ( Telu ) Li Department of Oceanography University of Hawaii at Manoa. Outline. 1. Nitrogen cycle in the oceans:

E N D
Conversion of organic nitrogen into N2 in the oceans: where does it happen?and how? Yuan-Hui (Telu) Li Department of Oceanography University of Hawaii at Manoa
Outline 1. Nitrogen cycle in the oceans: 2. Three end-member mixing model and the aerobic partial nitrification hypothesis. 3. Nitrate deficits by the aerobic partial nitrification and the anoxic denitrification. 4. Conclusions 5. Acknowledgement
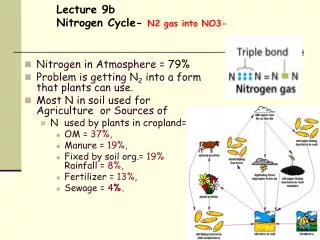
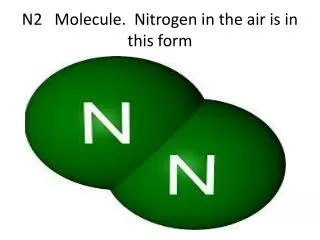
1. Nutrient cycle in the ocean: Redfield Ratios and Nitrification by nitrifying bacteria [oxic]: 138 O2 + (CH2O)106(NH3)16(H3PO4) H2PO4 +16 NO3 + 106 CO2 + 17 H+ + 122 H2O P\ N\ Corg\- O2 = 1\16\106\138 or rp = - O2/ P = 138 rn = - O2/ N = 8.63 rc = - O2/ Corg = 1.30 phytoplankton
Denitrification by denitrifying bacteria [anoxic and suboxic] phytoplankton94.4 NO3-+ 93.4 H+ + (CH2O)106(NH3)16(H3PO4) H2PO4 +55.2 N2 + 106 CO2 + 177.2 H2OP\- N\ Corg\ N2 = 1\94.4\106\55.2Anaerobic ammonia oxidation (anammox) by anammox bacteria:NH4+ + NO2- N2 + 2 H2O
2.Three end member mixing model(Li and Peng, 2002)1 = f1 + f2 + f3 (1) = f11 + f22 + f33 (2) S = f1S1 + f2S2 + f3S3(3) O2+ rnNO3 = (NO) = f1(NO)1 + f2(NO)2 +f3(NO)3(4) O2=0+1+2S- rnNO3(4a)where, rn = -O2 / NO3 SimilarlyO2= A0+ A1+ A2S– rpPO4(5a)where,rp = -O2 / PO4 Also:DA =0+1 +2S +3O2 (6a)where, rc= 1/(3 – 0.5/rn); rc = -O2/ CorgDA = (DIC – Alk/2)
2a. Aerobic Partial nitrification hypothesis: Unidentified bacteria have evolved in a low oxygen (but oxic) and high nitrate environment (such as in oxycline, marine snow and fecal pellets, sediments) to utilize both oxygen and nitrate as terminal electron acceptors during oxidation of organic matter, and convert some organic nitrogen into N2, N2O, and NO.
3. Nitrate deficit by partial nitrification (dN) and denitrification(dN”) Na = 16(P - 0.16) Nb = -3.223 + 16.772P + 0.574 P2 - 0.465 P3When Nb N Na dN = Na - N ; When N < NbdN = Na - NbdN” = Nb - N ; N* by Deutsch et al (2001):N* = (N - Na’)Na’ = 16(P - 0.181) -N* dN + dN”
(mol/kg) i7n
Additional support for the aerobic partial nitrification hypothesis: 1. Schmidt et al (2004) showed that a wild-type of Nitrosomonas europaea in chemostat cell cultures can produce nitrogen gases (N2, NO, and N2O) during aerobic (O2 ~ 125M) oxidation of ammonia, using genes encoding reduction enzymes such as nitrite reductase, nitric oxide reductase etc. For example,NH4+ (ammonia monooxygenase) NH2OH (hydroxylamine oxidoreductase) NO2(nitrite reductase) NO (nitric oxide reductase) N2O (not yet identified nitrous oxide reductase) N2. 2. Aerobic and anaerobic ammonia oxidizing bacteria are coupled in suspended organic particles in a low-oxygen (O2 ~ 5 M) CANON reactor (Nielsen et al., 2005) to produce N2
3. Codispoti et al. (2001) estimated the excess N2 in the water column of the Arabian Sea, using the Ar/N2ratio in the water column and in the air. They found that the excess N2 is substantially greater than the N2 produced by the denitrification process.
Acknowledgement: Ms Lauren Kaupp patiently showed me how to use the Ocean Data View program, which was provided by Dr. Reiner Schlitzer. Discussions with Drs. James Cowen, David Karl, Marcel Kuypers, FredMackenzie, Hiroaki Yamagichi and Wajih Naqvi were most fruitful. Many thanks to Professor Yoshiki Sohrin for kindly inviting me here. This work is supported by a NOAA grant to Y.H. Li and T.H. Peng.
Redfield ratios: P\N\Corg\-O2 = 1\16\106\138; (CH2O)106(NH3)16(H3PO4) Antarctic Indian Ocean: P\N\Corg\-O2 = 1\(151)\(832)\(1349) Deep equatorial Indian Ocean: P\N\Corg\-O2 = 1\(101)\(945)\(1307) Average remineralization ratios for the warm water mass: P\N\Corg\-O2 = 1\(15.60.7)\(1109)\(1598) Anderson’s (1995) remineralization ratios and phytoplankton formula: P\N\Corg\-O2 = 1\16\106\150; (C106H48)(H2O)38(NH3)16(H3PO4)
1. The remineralization ratios (P\N\Corg\-O2) of organic matter in the oxygenated regions of Indian Ocean change systematically with latitude and depth. 2. The average remineralization ratios for the Indian warm water masses (potential temperature ~ 10°) are P\N\Corg\-O2 = 1\(15.60.7)\(1109)\(1598).These are comparable to the traditional Redfield ratios P\N\Corg\-O2 = 1\16\106\138,and are in good agreement with Anderson’s (1995) values of P\N\Corg\-O2 = 1\16\106\150within the given uncertainties. 5. Conclusions