Download
1 / 12
120 likes | 251 Views
CheckImage Collaborative Communications Work Group. Key Messages:

E N D
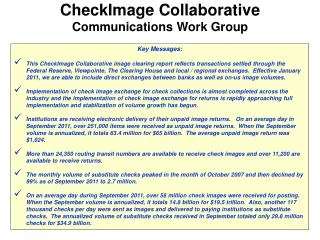
CheckImage Collaborative Communications Work Group • Key Messages: • This CheckImage Collaborative image clearing report reflects transactions settled through the Federal Reserve, Viewpointe, The Clearing House and local / regional exchanges. Effective January 2011, we are able to include direct exchanges between banks as well as on-us image volumes. • Implementation of check image exchange for check collections is almost completed across the industry and the implementation of check image exchange for returns is rapidly approaching full implementation and stabilization of volume growth has begun. • Institutions are receiving electronic delivery of their unpaid image returns. On an average day in September 2011, over 251,000 items were received as unpaid image returns. When the September volume is annualized, it totals 63.4 million for $65 billion. The average unpaid image return was $1,024. • More than 24,350 routing transit numbers are available to receive check images and over 11,200 are available to receive returns. • The monthly volume of substitute checks peaked in the month of October 2007 and then declined by 99% as of September 2011 to 2.7 million. • On an average day during September 2011, over 58 million check images were received for posting. When the September volume is annualized, it totals 14.8 billion for $19.5 trillion. Also, another 117 thousand checks per day were sent as images and delivered to paying institutions as substitute checks. The annualized volume of substitute checks received in September totaled only 29.8 million checks for $34.9 billion.
Highlights: Chart reflects volume received by DFIs for payment. Average daily image volume grew from 58.23 to 58.99 million from October 2009 to September 2011. September 2011 volume annualized is 14.8 billion images received per year. Average # of Images Received /Day # Items in Millions Data Sources: Transactions settled through the Federal Reserve, Viewpointe, The Clearing House, selected ECCHO Full and Participating Members and other local / regional exchanges Oct-09 Apr-10 Apr-11 Oct-10 Aug-10 Feb-10 Feb-11 Jun-11 Jun-10 Dec-10 Dec-09 Sept-11
Highlights: Chart reflects the number of R/Ts available to receive images from other DFIs or an intermediary. Number of image-available receiving R/Ts grew from 20,788 to 24,394 from October 2009 to September 2011. R/Ts Available to Receive Images # of Image-Available R/Ts Data Sources: Transactions settled through the Federal Reserve, Viewpointe, The Clearing House, selected ECCHO Full and Participating Members and other local / regional exchanges Oct-09 Jun-10 Oct-10 Apr-10 Apr-11 Feb-10 Aug-10 Feb-11 Jun-11 Dec-09 Dec-10 Sept-11
Highlights: Chart reflects checks received by DFIs for payment. The monthly dollar amount received grew from $1.50 to $1.78 trillion. Annualized September 2011 dollar amount = $19.6 trillion/yr. $ Amounts of Images & Substitute Checks Forward Collection Only $ Amounts in Billions Data Sources: Transactions settled through the Federal Reserve, Viewpointe, The Clearing House, selected ECCHO Full and Participating Members and other local / regional exchanges Oct-09 Jun-10 Oct-10 Apr-10 Apr-11 Feb-10 Aug-10 Feb-11 Jun-11 Dec-09 Dec-10 Sept-11
Highlights: Chart reflects volume received by DFIs for payment. Substitute Check volume has decreased to the volume of February ’05. # of Images & Substitute Checks Forward Collection Only # Items in Millions Images Data Sources: Transactions settled through the Federal Reserve, Viewpointe, The Clearing House, selected ECCHO Full and Participating Members and other local / regional exchanges Substitute Checks Oct-09 Jun-10 Oct-10 Apr-10 Apr-11 Feb-10 Aug-10 Feb-11 Jun-11 Dec-09 Dec-10 Sept-11
Highlights: Chart reflects the number of R/Ts available to receive unpaid image returns from other DFIs or an intermediary. From October 2009 to September 2011, the number of R/Ts available to receive unpaid image returns grew from 5,089 to 11,219. (Data sources were modified for August 2010 forward) Number of R/Ts Available to Receive Image Returns # of R/Ts Available to Receive Returns Data Sources: Transactions settled through the Federal Reserve, Viewpointe, The Clearing House, selected ECCHO Full and Participating Members and other local / regional exchanges Oct-09 Jun-10 Oct-10 Apr-10 Apr-11 Feb-10 Aug-10 Feb-11 Jun-11 Dec-09 Dec-10 Sept-11
Highlights: This chart reports the volume trend of unpaid image returns delivered electronically to the receipt location designated by the bank of first deposit. Between October 2009 to September 2011, the volume of image returns has increased by 28% from an average daily volume of 195,000 to 251,000 (23 days in September). Average # of Image Returns/Day # Items in Thousands Data Sources: Transactions settled through the Federal Reserve, Viewpointe, The Clearing House, selected ECCHO Full and Participating Members and other local / regional exchanges Oct-09 Jun-10 Oct-10 Apr-10 Apr-11 Feb-10 Aug-10 Feb-11 Jun-11 Dec-09 Dec-10 Sept-11
Highlights: This chart reports the dollar amount trend of unpaid image returns delivered electronically to the receipt location designated by the bank of first deposit. Between October 2009 and September 2011, the monthly dollar amount of image returns has grown from $4.4 to $5.9 billion. The average dollar amount of image returns ranged from a low of $1,024 per return to a high of $1,215. $ Amount of Returns $ Amounts in Millions Data Sources: Transactions settled through the Federal Reserve, Viewpointe, The Clearing House, selected ECCHO Full and Participating Members and other local / regional exchanges Oct-09 Jun-10 Oct-10 Apr-10 Apr-11 Feb-10 Aug-10 Feb-11 Jun-11 Dec-09 Dec-10 Sept-11
Highlights: Chart reflects volume received by DFIs for payment. Average daily image volume grew from .08 to 62.28 million from Qtr 1 2005 to Qtr 3 2011. Qtr 3 2011 volume annualized is 16.4 billion images received per year. Average # of Images Received /Day # Items in Millions Data Sources: Transactions settled through the Federal Reserve, Viewpointe, The Clearing House, selected ECCHO Full and Participating Members and other local / regional exchanges
Highlights: Chart reflects check images received by DFIs for payment. The quarterly dollar amount of images received grew from $1.7 billion to $5.4 trillion. Annualized Quarter 3 2011 dollar amount = $21.6 trillion/yr. $ Amounts of Images Received by Paying Institution $ Amounts in Billions Data Sources: Transactions settled through the Federal Reserve, Viewpointe, The Clearing House, selected ECCHO Full and Participating Members and other local / regional exchanges
Highlights: Chart reflects return volume received by DFIs. Average daily image volume grew from 103 to 256 thousand from Qtr 1 2009 to Qtr 3 2011. Qtr 3 2011 volume annualized is 64.6 million return images received per year. Average Number of Returns Received / day $ Amounts in Thousands Data Sources: Transactions settled through the Federal Reserve, Viewpointe, The Clearing House, selected ECCHO Full and Participating Members and other local / regional exchanges
Highlights: Chart reflects returned check images received by DFIs for payment. The quarterly dollar amount of images received grew from $7.4 to $17.6 billion. Annualized Quarter 3 2011 dollar amount = $72 billion/yr. $ Amounts of Returned Images Received by Paying Institution $ Amounts in Billions Data Sources: Transactions settled through the Federal Reserve, Viewpointe, The Clearing House, selected ECCHO Full and Participating Members and other local / regional exchanges