Download

1 / 26
260 likes | 334 Views
Explore the processes impacting air quality, from global to local scales. Learn about aloft ridges and troughs, convergence, divergence, and rising/sinking air in this comprehensive short course on meteorology and air quality forecasting. Discover how temperature soundings, inversions, and mixing affect pollutant concentrations. Enhance your understanding of how sunlight, clouds, wind, and stability influence air quality. Join us and gain insights into forecasting air quality based on meteorological conditions.

E N D
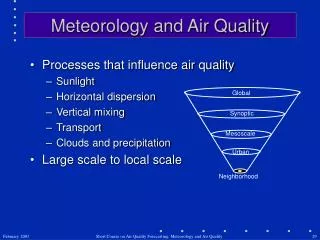
Global Synoptic Mesoscale Urban Neighborhood Meteorology and Air Quality • Processes that influence air quality • Sunlight • Horizontal dispersion • Vertical mixing • Transport • Clouds and precipitation • Large scale to local scale Short Course on Air Quality Forecasting: Meteorology and Air Quality
Basic Weather • Aloft ridges and troughs • Rising and sinking air • Surface highs and lows • Ridges, troughs, and temperature soundings • Inversions • Stability • Mixing • Clouds and precipitation • Winds • Synoptic scale • Meso- and local-scale • Transport (surface and aloft) Short Course on Air Quality Forecasting: Meteorology and Air Quality
Increasing Height Ridge Ridge 500 mb 500 mb Trough Trough Surface Very warm column Cool column Warm column Very cool column Aloft Ridges and Troughs (1 of 3) • Mountains and valleys of warm and cool air • The height of the 500-mb pressure altitude depends on the relative temperature of the column Short Course on Air Quality Forecasting: Meteorology and Air Quality
Convergence Divergence Convergence Aloft Ridges and Troughs (2 of 3) • Waves (ridges and troughs) generally move west to east • Winds generally travel faster around ridges and slower around troughs • Areas of aloft convergence and divergence Wave movement Fast wind Fast 500 mb Ridge Slow Trough Surface Short Course on Air Quality Forecasting: Meteorology and Air Quality
Convergence Convergence Divergence Rising Sinking Sinking High Pressure Low Pressure High Pressure Aloft Ridges and Troughs (3 of 3) • Aloft divergence causes rising motion and a surface low • Aloft convergence causes sinking motion and a surface high • Surface pressure patterns are offset from aloft patterns 500 mb Ridge Trough Surface Short Course on Air Quality Forecasting: Meteorology and Air Quality
Tropopause convergence divergence subsidence updrafts top of boundary layer convergence divergence High Low Stull (2000) Rising and Sinking Air • Sinking motion • Warms the air • Creates stable conditions • Reduces vertical mixing • Creates clear skies • Associated with poor air quality • Rising motion • Cools the air • Creates unstable conditions • Increases mixing • Causes cloud cover • Associated with good air quality Short Course on Air Quality Forecasting: Meteorology and Air Quality
Ridge = Sinking = Surface high 1008 mb 5580 m 5700 m 1016 mb H 5820 m 1024 mb H Surface Highs and Lows – Relationship to Aloft Pattern (1 of 2) 500-mb heights on the afternoon of January 7, 2002 (00Z Jan 8) Surface pressure on the afternoon of January 7, 2002 (00Z Jan 8) High PM2.5 in Salt Lake City, Utah Short Course on Air Quality Forecasting: Meteorology and Air Quality
Trough = Rising = Surface low 1012 mb 1012 mb 1020 mb 5280 m 1004 mb L 5400 m 5520 m 1012 mb 5640 m 5760 m Surface Highs and Lows – Relationship to Aloft Pattern (2 of 2) 500-mb heights on the afternoon of January 22, 2002 (00Z Jan 23) Surface pressure on the afternoon of January 22, 2002 (00Z Jan 23) Low PM2.5 in Salt Lake City, Utah Short Course on Air Quality Forecasting: Meteorology and Air Quality
Life-cycle of Aloft and Surface Patterns Surface High Approaching Ridge Backside Surface High Warm Front Approaching Trough Surface Low Cold Front Trough Short Course on Air Quality Forecasting: Meteorology and Air Quality
H Ridges and Temperature Soundings Ridge = Sinking = Strong Inversion = Poor Air Quality T Td Salt Lake City, Utah, temperature and dew point temperature sounding on January 7, 2002, at 0500 MST Short Course on Air Quality Forecasting: Meteorology and Air Quality
Troughs and Temperature Soundings Trough = Rising = No Inversion = Good Air Quality Td T Salt Lake City, Utah, temperature and dew point temperature sounding on January 22, 2002, at 0500 MST Short Course on Air Quality Forecasting: Meteorology and Air Quality
Inversions • Subsidence • Created by sinking air associated with ridges • Can limit daytime mixing depth and plays important role in daytime pollutant concentrations • Nocturnal • Created by cooling ground at night • Strongest with clear skies, light winds, and long nights • Can trap emissions, released during the overnight hours, close to the ground • Advection • Created when warm air aloft moves over cooler air below • Can occur ahead of an approaching cold front • Can cause poor air quality, despite the lack of an aloft ridge Short Course on Air Quality Forecasting: Meteorology and Air Quality
Pollutants mix into a smaller volume resulting in high pollution levels Inversion Holds Strong and low inversion Height RL CBL NBL NBL Sunset Midnight Sunrise RL = Residual Layer CBL = Convective Boundary Layer NBL = Nocturnal Boundary Layer = Surface-based vertical mixing = Surface-based mixing depth Inversions and Mixing Temperature soundings Pollutants mix into a large volume resulting in low pollution levels Weak and high inversion Inversion Breaks RL Height CBL NBL NBL Midnight Sunrise Sunset Short Course on Air Quality Forecasting: Meteorology and Air Quality
2000 m Estimated mixing height T 1500 m Dry adiabat 1000 m 500 m Forecasted max. temp. Mixing and Temperature Soundings – Estimating Mixing Height • Holzworth Method – Starting at the forecasted maximum temperature, follow the dry adiabat (dashed line) until it crosses the morning sounding. This is the estimated peak mixing height for the day. • The dry adiabatic rate is the rate at which an unsaturated air parcel cools as it rises. It is defined as -9.8ºC per km. • Uncertainty in mixing height estimates can be caused by changes in aloft temperatures or errors in predicted maximum temperatures. 2000 m T 1500 m Dry adiabat Estimated mixing height 1000 m 500 m Forecasted max. temp. Short Course on Air Quality Forecasting: Meteorology and Air Quality
2000 m 2000 m T T 1500 m 1500 m Estimated mixing height Unlimited mixing 1000 m 1000 m Dry adiabat Dry adiabat 500 m 500 m Forecasted max. temp. Forecasted max. temp. Stability – Beyond Inversions • A measure of the ability of an air parcel to rise • Inversions create stable conditions • Stable conditions in a temperature profile can exist without an inversion Short Course on Air Quality Forecasting: Meteorology and Air Quality
Clouds and Precipitation (1 of 2) • Clouds form when the air becomes saturated • Adding water vapor • Cooling air • Many processes add water vapor or cool air • Rising motion • Trough • Daytime heating • Cold front undercutting warm air (or vice versa) • Orographic • Air in contact with cooler surface • Air moving over water • Others Short Course on Air Quality Forecasting: Meteorology and Air Quality
Clouds and Precipitation (2 of 2) • Clouds and fog can increase the conversion of sulfur dioxide to sulfate from 1% per hour to 50% per hour • Important in the East where one-half of PM2.5 is sulfate • Clouds reduce ozone photochemistry • Precipitation removes PM10 but has little direct impact on PM2.5 • Convective clouds can vent pollution from the boundary layer under stable conditions • Inhibits heating and ability to break inversion (mid and high clouds) Short Course on Air Quality Forecasting: Meteorology and Air Quality
Winds Horizontal dispersion and transport • Synoptic scale • Winds are driven by large high- and low-pressure systems • Meso- and local-scale • Land/sea or lake breeze • Mountain/valley • Terrain forced • Diurnal cycles • Foster stagnation and recirculation • Local flows are often difficult for weather models to predict but can be predicted by forecasters with knowledge of the area • Surface vs. boundary layer • Transport at different levels • Mixing during the day Short Course on Air Quality Forecasting: Meteorology and Air Quality
Winds – PM2.5 Variation with Synoptic Pattern Low PM2.5 High PM2.5 Moderate PM2.5 High PM2.5 Lines of constant surface pressure Adapted from Comrie and Yarnal (1992) Line of constant 500-mb height General synoptic surface flow Short Course on Air Quality Forecasting: Meteorology and Air Quality
Land Breeze Lake Breeze 5880 m Lake Michigan Lake Michigan 500-mb heights on July 18, 1991 Cool Warm Hot Warm 1016 mb Synoptic Flow H Surface pattern on July 18, 1991 Winds – Mesoscale (1 of 2) Surface winds on July 18, 1991, at (a) 0600 CDT and (b) 1500 CDT. Peak ozone concentrations on this day were about 170 ppb. (Dye et al., 1995) Short Course on Air Quality Forecasting: Meteorology and Air Quality
Trapped particulate matter is visible in the Salt Lake Valley as viewed from the Wasatch foothills. Univ. of Utah Winds – Mesoscale (2 of 2) With a strong inversion and the surrounding mountains, surface winds are decoupled from the aloft winds. The strong inversion and light surface winds allow for high PM2.5 concentrations. Short Course on Air Quality Forecasting: Meteorology and Air Quality
Transport The 24-hr average PM2.5 concentration in Boston on 7/7/02 was 62.7 µg/m3 Source: NOAA HYSPLIT Source: NASA Backward trajectoryending at 0600 EST on 7/7/02 2-km satellite image from 1235 EST on 7/7/02 Short Course on Air Quality Forecasting: Meteorology and Air Quality
Sinking Motion Warms, Dries, and Stabilizes Surface High Local Flows and/or Light Winds, Possible Transport Clear Skies Photochemistry Stagnation/Recirculation Summary – Meteorology Associated with Poor AQ Ridge of High Pressure Creates Temperature Inversion Reduces Vertical Mixing Poor Air Quality Short Course on Air Quality Forecasting: Meteorology and Air Quality
Surface Low Moderate to Strong Winds (Transport) Cloudy Skies Reduces Photochemistry(but may enhance PM2.5 chemistry) Horizontal Dispersion Good Air Quality Summary – Meteorology Associated with Good AQ Trough of Low Pressure Rising Motion Cools, Moistens, and Destabilizes No Temperature Inversion Enhances Vertical Mixing Short Course on Air Quality Forecasting: Meteorology and Air Quality
Variable PM Ozone CO Inversion Strength High High High Surface Temp. Medium High High Humidity High Medium Low Aloft Pattern Medium High Medium Cloud Cover Low High Medium Wind Speed High Medium High Persistence High High High Importance of each variable varies by region and season Summary – Importance of Variables Short Course on Air Quality Forecasting: Meteorology and Air Quality
Summary • Processes that influence air quality • Sunlight • Horizontal dispersion • Vertical mixing • Transport • Clouds and Precipitation • Next step – Meteorological Products and Examples • Questions Short Course on Air Quality Forecasting: Meteorology and Air Quality