Download
1 / 14
140 likes | 301 Views
eas6792 air pollution meteorology. Term Paper Diurnal vertical concentration profile of CO in an urban environment by Bur ç ak Kaynak. Introduction. Air quality in urban areas connection between air pollution and human health emissions and concentrations of primary pollutants

E N D
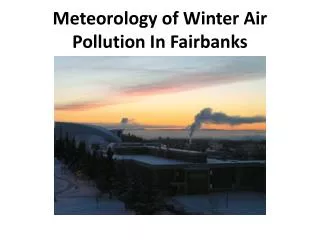
eas6792air pollution meteorology Term Paper Diurnal vertical concentration profile of CO in an urban environment by Burçak Kaynak
Introduction Air quality in urban areas • connection between air pollution and human health • emissions and concentrations of primary pollutants shows extremely strong spatial and temporal variations • characterization of urban air pollution is fairly complicated CO and other pollutants may • concur in several chemical processes, contributing to the formation of other pollutants (o3) • have injurious effects on the health • damage vegetation and materials, • alter temperature and wind distribution, generally affect urban climates
Introduction Concentrations of pollutants in urban areas balance between pollutant accumulation and dispersion Strong gradients of gaseous and particulate pollutants (in the vertical and horizontal direction) mainly due to • activities of emission sources • rapid mixing • dilution of emissions CO is a good indicator to understand the dispersion and advection processes in the urban areas
Introduction The diurnal vertical profile of CO in a suburban area will be calculated by Euler explicit method and compared with the actual measurements assumptions: velocity (u) and eddy diffusion coefficient (Kz) profiles for typical urban atmosphere diurnal emission profiles of CO, scaled according to the max. emissions boundary layer heights for 2 cases: day time(1200m), night time (200m) no sources or sinks (long lifetime of CO)
Measurements for comparison “Wintertime vertical profiles of air pollutants over a suburban area in central Taiwan” (Chen et al., 2002.) Vertical CO profiles through 1200 m
System equation δC/δt = Kz(z)*δ2C/δz2 +u(z)*(Co-C)/ δz By using Taylor series, at steady state 0 = Kz(z)[ C(z+Δz)-2 C(z)+ C(z-Δz)]/ Δz2 + (u(z)C(z))/Δz say C(z+Δz) =Ci+1 C(z) =Ci C(z-Δz) =Ci-1 0 = Kz i[ Ci+1 - 2Ci + Ci-1]/ Δz2 + (u i Ci)/Δz So Ci+1 = [ 2Ci - Ci-1] - (u i Ci)*Δz/Kz i
Expected outcomes the average vertical profile of vehicular pollutant conc.s the general exponential form (rather than simple exponential function or Gaussian distribution) Maximums morning hours w/ relatively high traffic and low mixing Good correlation between traffic load and mechanical mixing Decreasing CO concentrations with height
Problems The concentrations are going to “zero” or “-” values immediately Possible reasons could be: The explicit method is unstable The velocities assumed are too high that they swept all the CO Problems in writing the algorithm or in coding in the Mathlab program
Future work • Finding the problems in the solution • Obtaining a reasonable vertical profile • Comparison of the day and night profiles • Effect of the traffic emission loads on vertical profiles • Comparison of the numerical solution with the measurements in the reference noted