Download
1 / 8
80 likes | 223 Views
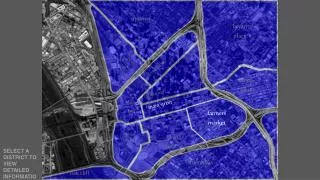
Farmers’ perception on use of forages in Bavi District. Dinh Van Binh, Ngo Tien Dzung and Nguyen Thi Mui. Introduction. Area: 421 km 2 (80% of sloping land) Agriculture land: 14,900 ha (planting crops: 12,100 ha) Unused land : 8,000 ha

E N D
Farmers’ perception on use of forages in Bavi District Dinh Van Binh, Ngo Tien Dzung and Nguyen Thi Mui
Introduction Area: 421 km2 (80% of sloping land) Agriculture land: 14,900 ha (planting crops: 12,100 ha) Unused land : 8,000 ha Population: 233,000 inhabitants (32 villages) Animal population (heads): Pigs 82,543 Buffaloes 11,200 Cattle 16,860 Goats 1,037 Poultry 271,000 Capital income:70 USD/year
Diagram of transferring technologies to farmers GRRC Research On-station On-farm Demonstrations Technologies transfer Farmers in provinces Farmers in Bavi
How to transfer technologies to the farmers ? Establishing the demonstrations at the Research Centre and in farm households around the Research Centre. Organizing visits, seminar workshops on research and extension of new technologies Making video-films illustrating new technologies of dairy goat production, crop planting, installation of biodigesters in sustainable farming system. Selection of places and farmers to apply the new technologies, cooperation with the Women’s Union and Extension Divisions in the management of the location. Training courses for extensionists and farmers on new technologies before transferring them to farmers. Support for farmers with improved animal breeds and planting materials of promising varieties for increasing feed resources for animals Helping farmers to solve problems or finding the market for consumption of their products
Edible biomass yield from forage species (tonnes/ha/year) ----------------------------------------------------------------------------------------- Biomass Dry matter Crude protein ------------------------------------------------------------------------------------------ Flemingia macrophylla 60.7 13.4 2.24 Trichanthera gigantea 62.7 8.1 1.33 Leucaena hybrid KX2 54.8 13.7 2.84 L. leucocephalla K636 39.7 9.9 2.1 L. Pallinda K748 45.2 11.6 2.5 Mulberry (Morus alba) 23.0 3.9 0.67 Bananas (pure stand) 90.7 13.4 - Trichanthera gigantea in association with banana 82.4 10.6 - P.Pupurceum 45-110 P.M. likoni 29-85 B. ruziziensis 40-85 M. esculanta Root 10-26 Leaves 1.2-5.1
Comparison of economic efficiency between two farming system (mean for household, million VND) __________________________________________________________Production Traditional system New system --------------------------- ------------------------------- Income Profit % Income Profit % ___________________________________________________________ Pig 3.3 0.5 15 3.3 0.8 30 Local cow 2.6 1.2 86 2.8 1.5 115 Local goat 1.8 0.6 50 2.4 1.2 100 Fish pond (m2) 0.25 0.15 150 6.0 4.2 242 Cassava (m2) 0.4 0.21 110 0.57 0.42 283 Sugar cane (m2) 1.6 1.1 220 Garden (m2) 0.45 0.23 104 0.78 0.54 257 Biogas 0.73 0.55 305 Total 8.7 2.84 41 18.2 10.2 129
Income of farmers(VND/month/person) ------------------------------------------------------------------------------------------ Farmers No of goats Traditional New system ------------------------------------------------------------------------------------------ 1 16 250,000 388,000 2 32 350,000 505,000 3 20 292,000 391,000 4 13 408,000 491,000 5 17 156,000 187,000 6 5 214,000 249,000 7 6 189,000 293,000 8 10 160,000 204,000 9 19 160,000 215,000 10 25 273,000 473,000 11 14 297,000 382,000 12 17 189,000 215,000 Average 16 245,583 332,750
Conclusions Research activities and transfer technologies have been carrying since 1991 up to now to farmers, which show potential value of multi-purpose crops and forages which can be used for animal feeding and improving the soil fertility The productivity of animals has increased when using protein-rich foliages with diets based on agricultural by-products Increase the economic efficiency of livestock production using the new cultivated forages and processing techniques based on feed resources in suitable farming system of the farm Increasing the number of farmers applying the new technologies, the number of participating farmers as the demonstrations increased yearly from 5 (1991) to 35 (1997) to 320 (2000)