Download
1 / 11
110 likes | 456 Views
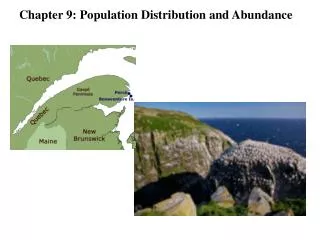
The Relationship Between Distribution and Abundance - Chapter 8. Spatial Scale of Geographic Ranges. Variations in Geographic Range size. Within a taxonomic group, most species have a small geographic range:. Geographic Ranges Vary With Latitude.

E N D
The Relationship Between Distribution and Abundance- Chapter 8
Variations in Geographic Range size • Within a taxonomic group, most species have a small geographic range:
Geographic Ranges Vary With Latitude The geographic range size of mammals increases with latitude
Rapoport’s Rules • Climatic variability is higher at high latitudes • Only organisms that can survive a broad range of climates will survive • Thus, they can occupy a broader geographical range • This works generally works out for terrestrial animals, but is a bit different for marine organisms.
Thibodaux Temperature Tolerance Range Water temperature is more stable at the equator and at the poles. Because there is a large temperature difference in the temperate latitudes, we would expect to see an adaptive difference to temperature variation in the middle latitudes. Critical temperature limits for shallow water marine fish. Blue = upper lethal limit, red = lower lethal limit.
Rapoport’s Rules • Product of Glaciation, particularly in the Northern Hemisphere. • Only those animals with a high dispersal capacity were able to colonize northern areas, thus having a large geographical range. • Does not explain for Southern Hemisphere • However, glaciation is probably a contributing factor
Rapoport’s Rules • Lack of competition in polar areas. • Because fewer species, level of competition may be smaller • Not yet tested
Boundaries of Geographical Ranges • Can be abrupt or gradual
Relationship Between Distribution and Abundance • There is a positive correlation between distribution and abundance – Hanski’s Rule. Distribution = number of traps scattered around Britain that collected that species. Abundance = average across all sites for all years 263 species of British moths
Hanski’s Rule Explained • Sampling Model – more rare (or hard to catch) species may not show up in all traps. • Ecological Specialization Model (Brown’s Model) – Species able to exploit a wide range of resources become both widespread and common. • Generalists versus a specialists • Local Population Model (metapopulation) – populations are found in discrete patches. • Species differ in their capacity to disperse • Species that disperse more are likely to be more common and more widespread