Download
1 / 29
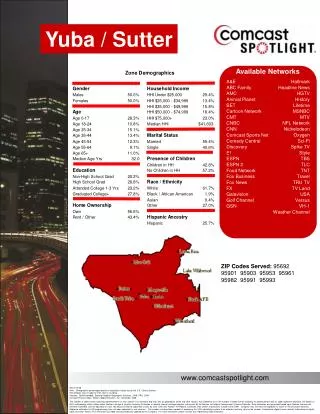
290 likes | 418 Views
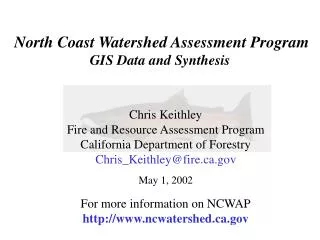
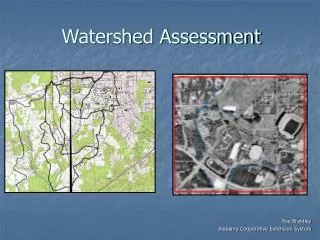
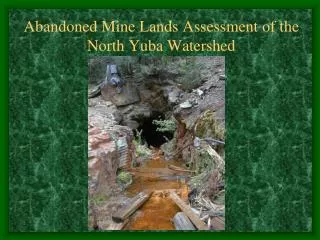
Abandoned Mine Lands Assessment of the North Yuba Watershed. Purpose and Scope. California Bay-Delta Authority contracted with the Department of Conservation to select a high priority watershed and perform an assessment of the abandoned mine issues.

E N D
Purpose and Scope • California Bay-Delta Authority contracted with the Department of Conservation to select a high priority watershed and perform an assessment of the abandoned mine issues. • Collected data during field work and combined with historical data to form the North Yuba Watershed database.
Watershed Selection • Watershed based on water flowing in to the bay-delta area. • Selection criteria for priority watersheds were created by analyzing many geospatial datasets.
Watershed was partitioned into 2 regions: Coast Range and the Sierra Nevada. • Sierra Nevada Province: anthropogenic mercury and arsenic • Coast Range Province: natural mercury and geothermal activity.
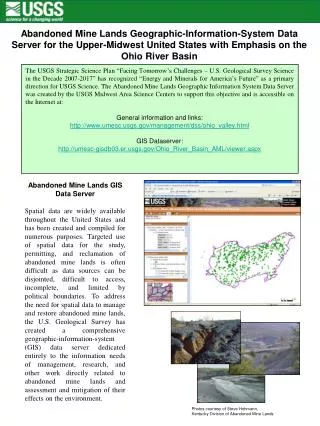
Geospatial datasets • Seven datasets used in watershed selection: • Principle Areas of Mine Pollution (PAMP), mines with production over $100,000 that could impact WQ • arsenic occurrences, derived from USGS’sMineral Resources Data System (MRDS). • public ownership, public vs. private. • acid rock drainage, sites with acid generating ore minerals and bodies from MRDS. • historic hard rock mining, from USGS 1:24,000 topo maps • historic hydraulic mining, from USGS 1:24,000 topo maps • watershed boundaries
Matrix for Scoring Watershed Categories Matrix for Ranking Watersheds
Mining History • First gold discovery party was lead by “Major” William Downie. • Claims were set based on “30 feet per man” • Population over 5,000 in 1851
Mining History, cont. • Surface placers worked intensively • Extensive hydraulic mining took place between the 1850s and 1884, with some operations worked into WWII. • Drift placer mining developed around the same time as hydraulic mining. • Lode gold production began in 1853 and lasted until the 1960’s
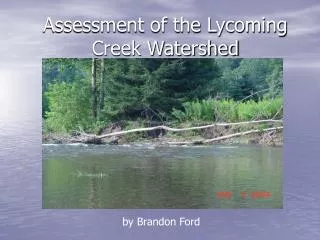
Sample Design • Contracted to visit at least 100 sites. • 128 mine sites actually visited.
Sample Design,cont. • Used USGS 7.5 minute topographic maps to determine where to catalog. • 400 topo symbols in North Yuba, 221 cataloged • Attempted to visit PAMP sites first but was unsuccessful.
Data Acquisition • Historical literature search (commodity, extent of workings, processing methods, etc.) • In the field, data collected on location, character and condition of mine sites and features. • Location information for each mine feature was collected with a Trimble GPS to an accuracy of 10 meters or less. • Screening parameters for on-site water sources: pH, electrical conductivity, oxidation-reduction potential and temperature. • Limited grab soil samples were taken when appropriate.
Soil Sampling • For underground mines: sampled tailings dumps and fine-grained waste rock dumps. • Dumps with varied physical characteristics were sampled in each discreet unit of the material. • For hydraulic mines, sampled fine-grained tailings, sediment down gradient of probable ground sluices and tunnel exits. • Also sampled mill areas and impoundments Methodology: • Top 1-2 inches was discarded and only material deeper than 1 inch was bagged in “Whirl-Pack” bags to be tested. • The 18 oz. bags were filled 1/3 to 3/4 full, sealed and placed in a second clean and empty bag and sealed. • GPS recorded the exact locations of each sample.
Soil Sample Analysis • The soil samples were shipped to CLS Labs in Rancho Cordova. • Samples were air dried and sieved to a particle size of 1.0 mm. • Samples analyzed for arsenic, lead, mercury using EPA methods: • EPA 74-71 (cold vapor test) for mercury • EPA 60-10 (ICP) for arsenic and lead
Arsenic Lead Mercury
Priority Listing of Sites • 2 priority lists developed Matrix for Ranking Sites Based on Chemical PAR Score Chemical PAR Score Ranking of Sites
Matrix for Scoring Sites by Chemical PAR Scores and Soil Sample Results Matrix for Ranking Soil Sampled Sites
Further Actions • Complete inventory of the watershed, both private and public lands. • Full site characterization, including detailed studies into the geology, hydrology and biology. • Sampling program to examine downstream effects of high mercury, lead and arsenic concentrations.
Comments Sarah Reeves (916) 322-4143 sreeves@consrv.ca.gov www.consrv.ca.gov