Download
1 / 9
90 likes | 254 Views
The "Where Are They Now?" reports provide a comprehensive overview of student performance in their next academic institutions, serving as a vital tool for schools preparing for Common Core Learning Standards. Released in May 2012, these reports help educators assess the outcomes of former students across various school types by comparing performance metrics between cohorts and subgroups. With an interactive dashboard and detailed data analysis capabilities, schools can identify areas for improvement in postsecondary readiness in academics, advising, and access strategies.

E N D
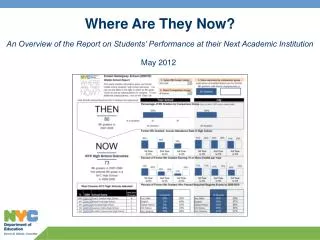
Where Are They Now? An Overview of the Report on Students’ Performance at their Next Academic Institution May 2012
Purpose • As schools gear up for the Common Core Learning Standards they need a baseline for how they are preparing their students for the ultimate goal of college and career readiness. • The Where Are They Now? reports are intended to provide schools with information on students’ performance at their next academic institution. • In 2011-12, the DOE released Where Are They Now? reports for all school types (early childhood, elementary, middle, high, transfer, and YABC programs). • The functionality of the reports enables schools to view the later outcomes of several cohorts of former students and to compare the performance of different subgroups. The 2012 reports were released in mid-May in ARIS private communities
Format The Where Are They Now? reports have three primary components: • Introduction Tab: Introduces users to the report functionality, purpose and uses of the report. • Dashboard Tab: Graphically depicts information about a cohort’s performance at their next academic institution. The Dashboard allows schools to compare the performance of a number of cohorts and comparison groups through its dynamic drop down menu functionality. • Data Tab: Allows schools to view all metrics on the Dashboard tab for the same cohorts and a larger number of comparison groups in a spreadsheet format. The spreadsheet allows schools to further analyze the data provided.
Introduction Tab The Introduction tab of the report provides background and overview on the content of the report. About This Report:Provides background and history on the report What is in the Report? Offers information on the different components of the report and how to use them Using This Report:Offers suggestions on how to improve schools’ postsecondary performance
Dashboard Tab The Dashboard tab provides graphical information on up to two comparison groups as well as a comparison with the City. The “THEN” section establishes a baseline, showing information on the selected cohort when they exited the school The “NOW” section follows those students that continued to a DOE school (or college) and shows performance information for those students at their next institution
Dashboard Tab The Dashboard tab is an interactive Excel tool that allows schools to view data for multiple cohorts and comparison groups of students. 1. Schools select one of four cohorts to view 2. Schools select from a number of subpopulations to compare performance 3. The legend shows the comparison group selected for the data in the Dashboard
Data Tab • The Data tab provides information on the metrics and cohorts displayed on the dashboard for a larger number of comparison groups. It also allows schools to view all the subgroup information in one spreadsheet, and to sort and filter for analysis. Data include: • Cohort • School / City • Comparison Group (# included and %) • Metric (# included and %)
Postsecondary Readiness Planning • Postsecondary Readiness involves three overlapping areas of school practice: • ACADEMICS • How does the course of study and the curriculum build towards mastery of ELA and Math standards that are required at the next level? • How does the curriculum explicitly teach non-academic behaviors that allow students to work independently, communicate effectively, advocate for themselves, etc.? • ADVISING • How are students advised about options and choices for their next level institution? How is planning built into student guidance and family engagement? • How does advising support lead to student enrollment in high performing next institutions? • ACCESS • How are students prepared to gain access to the program that best meets their needs?
For More Information • For technical support on the Where Are They Now? reports, contact your Network Data/IT liaison or WATN@schools.nyc.gov • For support in using the Where Are They Now? reports to improve instruction and programming, contact your network instructional staff.