Download

1 / 13
150 likes | 419 Views
UJI T PAIRED. Penyajian. Tabel 1. Distribusi rata-rata berat badan bayi yang dilahirkan berdasarkan kunjungan selama kehamilan pada tenaga kesehatan / antenatal care ( Anc ) di Kec.X Tahun 2012. Contoh Kasus 2.

E N D
Penyajian Tabel 1. Distribusi rata-rata beratbadanbayi yang dilahirkanberdasarkankunjunganselamakehamilanpadatenagakesehatan / antenatal care (Anc) diKec.XTahun 2012
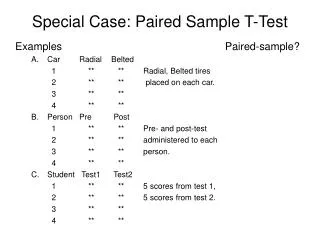
ContohKasus 2 • Dari data yang tersediaingindiketahuiapakahadaperbedaan rata-rata hbpadaibusebelumdansesudahpemberian tablet Fe
Langkah-Langkah • Hipotesis Ho : Tidakadaperbedaan rata-rata kadarhbibusebelumdansesudahpemberian tablet Fe Ha : Adaperbedaan rata-rata kadarhbibusebelumdansesudahpemberian tablet Fe. • Ujibeda 2 mean Dependen, Two Tail • Level signifikansi α=0.05
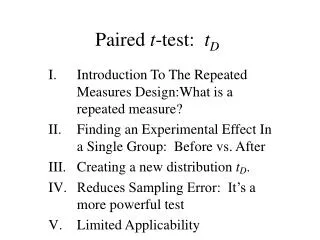
4. Uji t dependen (paired t-test) P value? 40.9
Diperolehnilai p (p value) sebesar 0,000. • Perbandingkannilai p dengannilai α : 0,000 < 0,05 , : p value < α ; Ho ditolaksehinggakesimpulannyaadaperbedaan rata-rata hbibusebelumdansesudahpemberian tablet Fe.
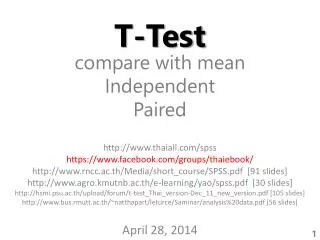
Pilih Analyze, Compare Mean (untukmelihatperbandingan rata-rata) danTaired-T-Test (uji t dependen)
Pilih (block) variabelhbsebelumdansesudahpemberian tablet Fe kemudianpindahkankesebelahkanan (paired) variables :
Hasiluji t dependen /paired t-test diperolehnilai p (p value) sebesar 0,000. • Perbandingkannilai p dengannilai α : 0,000 < 0,05 , : p value < α ; Ho ditolaksehinggakesimpulannyaadaperbedaan rata-rata hbibusebelumdansesudahpemberian tablet Fe.
Penyajian Tabel 2. Distribusi rata-rata kadarhaemoglobinIbusebelumdansesudahpemberian Tablet Fe diKec.XTahun 2012