Download
1 / 47
470 likes | 596 Views
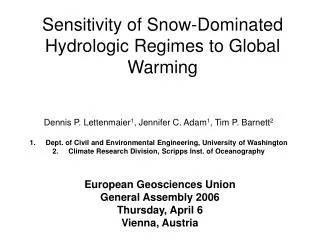
Sensitivity of Snow-Dominated Hydrologic Regimes to Global Warming. Dennis P. Lettenmaier 1 , Jennifer C. Adam 1 , Tim P. Barnett 2 Dept. of Civil and Environmental Engineering, University of Washington Climate Research Division, Scripps Inst. of Oceanography. European Geosciences Union

E N D
Sensitivity of Snow-Dominated Hydrologic Regimes to Global Warming Dennis P. Lettenmaier1, Jennifer C. Adam1, Tim P. Barnett2 Dept. of Civil and Environmental Engineering, University of Washington Climate Research Division, Scripps Inst. of Oceanography European Geosciences Union General Assembly 2006 Thursday, April 6 Vienna, Austria
1. Background • “On a global scale, the largest changes in the hydrological cycle due to warming are predicted for the snow-dominated basins of mid- to higher latitudes …” (Barnett et al, 2005) • Approximately one-sixth of the world’s population lives in river basins that are strongly affected by snowmelt, and for which reservoir storage is unable to substantially attenuate seasonal shifts in runoff. • This region accounts for roughly one-quarter of the global gross domestic product. • Reduction of snow affected area can roughly be estimated on the basis of movement of the snowline (lower boundary of transient rain-on-snow zone) by the psuedo-adiabatic lapse rate, or roughly 6 oC/km.
Typical hydrographs of snow, transient (rain and snow) and rain dominated watersheds in northwestern U.S.
Map of Snowmelt-Dominated Regions Legend {Snowfall÷Runoff ≥ 50%} – {Basins with large storage} Basins with ≥ 50% Runoff Derived from Snowmelt- Dominated Regions
Population • includes approximately one-sixth of the global population
Gross Domestic Product • includes roughly one-quarter of global GDP
Earlier Onset of Snowmelt Earlier Peak Runoff Reduced Surface Water Availability During Summer/Autumn (seasons of peak demand) Warming Less Storage of Water in Snow pack (snow rain) Reduction in Peak Runoff Mechanisms for shift in seasonal hydrographs in a warming climate
Mountainous Regions • snowmelt dominated regions occupy regions pole-ward of 45° • exceptions include mountainous areas (lower latitudes) and areas warmed by ocean waters (higher latitudes)
As the West warms, winter flows rise and summer flows drop I.T. Stewart, D.R. Cayan, M.D. Dettinger, 2004, Changes toward earlier streamflow timing across western North America, J. Climate (in review) Figure courtesy of Iris Stewart, Scripps Inst. of Oceanog. (UC San Diego)
Trends in fraction of annual runoff 1947-2003 (cells > 50 mm of SWE on April 1) June March Relative Trend (% per year) Figure courtesy of Alan Hamlet, U. Washington
-150 -120 -90 -60 -30 0 30 60 90 120 150 90 90 1 60 60 5 4 6 2 7 30 30 8 9 0 0 3 -30 -30 -60 -60 -90 -90 -150 -120 -90 -60 -30 0 30 60 90 120 150 1 MacKenzie 2 Mississippi 3 Amazon 4 Severnaya Dvina 5 Yenisei 6 Amur 7 Yellow 8 Xi 9 Mekong Global Climate Change Selected Basins from Nijssen et al, Climatic Change, 2001
Mackenzie Yenisei Severnaya Dvina SON JJA MAM DJF Amur Mississippi Yellow SON JJA Season in which change was experienced MAM DJF Mekong Xi Amazon SON JJA MAM DJF DJF MAM JJA SON DJF MAM JJA SON DJF MAM JJA SON -5% +5% -10% +10% Runoff Sensitivity Change in Runoff as a result of change in Precipitation Season in which change was imposed from Nijssen et al, Climatic Change, 2001
Mackenzie Yenisei Severnaya Dvina SON JJA MAM DJF Amur Mississippi Yellow SON JJA Season in which change was experienced MAM DJF Mekong Xi Amazon SON JJA MAM DJF DJF MAM JJA SON DJF MAM JJA SON DJF MAM JJA SON Season in which change was imposed -5% +5% -10% +10% Runoff Sensitivity Change in Runoff as a result of change in Temperature from Nijssen et al, Climatic Change, 2001
Diminishing Sierra Snowpack% Remaining, Relative to 1961-1990 Total snow losses by the end of the century: 29–73% for the lower emissions scenario (3-7 MAF) 73–89% for higher emissions (7-9 MAF – 2 Lake Shastas) Dramatic losses under both scenarios Almost all snow gone by April 1 north of Yosemite under higher emissions Visual courtesy Ed Maurer
Future Spring Snowpack Remainingby Elevation as a % of 1961-1990 levels Losses greatest below 3,000 m: 37–79% for B1 81–94% for A1fi. Below 1800 m (~6000 ft) >80% April 1 snow loss under all simulations Below 2600 m (8500 ft) >75% loss for 3 of 4 simulations, both of high emissions scenarios Visual courtesy Ed Maurer
Impacts on Ski Season • Warmer temperatures result in: • Less precipitation falling as snow in winter • Earlier melt of accumulated snow • These combine to shorten the ski season Photo: SwissRe Visual courtesy Ed Maurer
Length of Ski Season • 28-41 days (4-6 weeks) shorter for B1 scenario • 39-44 days (6 weeks) shorter for A1fi • Retreat of season start: 5-14 days (losing end of November and early December) • This is at midpoint year of 2035 – in our lifetimes. Visual courtesy Ed Maurer
Length of Ski Season Minimum ski conditions never attained • 49-106 days(7-15 week)shorter for B1 scenario • 103 days shorter (15 week)to zero day ski season for A1fi • Retreat of season start: at least 22 days • This is at midpoint year of 2085 – in our childrens’ and grandchildrens’ lifetimes.
5. Water resources implications in the western U.S.: The Accelerated Climate Prediction Initiative (see Climatic Change special issue, Jan-Feb. 2004, for details)
BAU 3-run average historical (1950-99) control (2000-2048) PCM Business-as-Usual scenarios Columbia River Basin (Basin Averages)
PCM Business-as-Usual scenarios California (Basin Average) BAU 3-run average historical (1950-99) control (2000-2048)
PCM Business-as-Usual Scenarios Snowpack Changes California April 1 SWE
Current Climate vs. Projected Climate • Storage Decreases • Sacramento • Range: 5 - 10 % • Mean: 8 % • San Joaquin • Range: 7 - 14 % • Mean: 11 %
Current Climate vs. Projected Climate • Hydropower Losses • Central Valley • Range: 3 - 18 % • Mean: 9 % • Sacramento System • Range: 3 – 19 % • Mean: 9% • San Joaquin System • Range: 16 – 63 % • Mean: 28%
Timeseries Annual Average PCM Projected Colorado R. Temperature ctrl. avg. hist. avg. Period 1 2010-2039 Period 2 2040-2069Period 3 2070-2098
Timeseries Annual Average PCM Projected Colorado R. Precipitation hist. avg. ctrl. avg. Period 1 2010-2039 Period 2 2040-2069Period 3 2070-2098
Annual Average Hydrograph Simulated Historic (1950-1999)Period 1 (2010-2039)Control (static 1995 climate)Period 2 (2040-2069)Period 3 (2070-2098)
Annual Releases to the Lower Basin target release
Annual Releases to Mexico target release
Summary of ACPI results • Columbia and California reservoir systems primarily provide within-year storage (total storage/mean flow ~ 0.3 – 0.5), whereas Colorado is an over-year system (~4) • Climate sensitivities in Columbia basin and California are dominated by seasonality shifts in streamflow, and may even be beneficial for hydropower. However, fish flow targets would be difficult to meet under altered climate, and mitigation by altered operation is essentially impossible. • California system operation is dominated by water supply (mostly ag), reliability of which would be reduced significantly by a combination of seaonality shifts and reduced (annual) volumes. Partial mitigation by altered operations is possible, but complicated by flood issues. • Colorado system is sensitive primarily to annual streamflow volumes. Low runoff ratio makes the system highly sensitive to modest changes in precipitation (in winter, esp, in headwaters); temperature changes are much less important.
Conclusions • Impacts of climate change on the hydrology of snowmelt dominated rivers (of which mountainous watersheds are a particularly important subset) are among the most predictable impacts of climate change • Transient snow domains are most “at risk”, but impacts will be felt in all ephemeral snow domains • Changes over the last century are detectable, and have already impacted the reliability of water supply systems in the western U.S. • Planning methods that incorporate ongoing and future climate change are urgently needed as operating agencies begin to recognize the problems and issues
Discharge, m3/s Discharge, m3/s Rhine River(Middelkoop et al. 2001) Aare River at Brugg Rhine River at Rheinfelden H. Middelkoop et al., Impact of climate change on hydrological regimes and water resources management in the Rhine Basin, Clim. Change, 49: 105-128, 2001. (Image: Ultrecht Univ., Netherlands)
Discharge, m3/s Rhine River(Middelkoop et al. 2001) Rhine River at Rees • Some Implications: • reduction of water availability during season of peak demand • increase in number of low-flow days (affects ship transport) • decrease in level of flood protection • decrease in annual hydropower production (some sub-basins) H. Middelkoop et al., Impact of climate change on hydrological regimes and water resources management in the Rhine Basin, Clim. Change, 49: 105-128, 2001. (Image: Ultrecht Univ., Netherlands)
Canadian Prairies (de Loë et al. 2001) • agriculture sensitive to drought (irrigation derived primarily from surface waters) • predictions include: decrease in snow-pack, earlier peak runoff, and lower summer soil moistures • implications: agriculture more at risk in a warming climate; and heightened competition with other water needs (aquatic habitat and down-stream requirements) R. de Loë et al., Adaptation options for the near term: climate change and the Canadian water sector, Global Env. Change, 11, 231-245, 2001.
Glaciers… Recession of Grinnell Glacier, Glacier National Park (1911 and 2000)