Download
1 / 21
210 likes | 231 Views
Claudio Lottaz and Rainer Spang. Decomposing Complex Clinical Phenotypes by Biologically Structured Microarray Analysis. Berlin Center for Genome Based Bioinformatics, Berlin (Germany). Computational Diagnostics, Max Planck Institute for Molecular Genetics, Berlin (Germany). Overview.

E N D
Claudio Lottaz and Rainer Spang Decomposing Complex Clinical Phenotypes by Biologically Structured Microarray Analysis Berlin Center for Genome Based Bioinformatics, Berlin (Germany) Computational Diagnostics, Max Planck Institute for Molecular Genetics, Berlin (Germany)
Overview Overview • Introduction • Using functional annotation forsemi-supervised classification • Heterogeneity vs. performance • Evaluation on cancer related data • Concluasions
Patients Genes D C Introduction Tumor Classification • Setting: • Data: gene expression profiles • Goal: prediction/classification of outcome/sub-type • More formally: • Many expression levels measured • Samples labelled as disease and control • Train classifier
Introduction State-of-the-Art • Various powerful methods: • Support vector machines • Shrunken centroids... • Regularization to fight overfitting: • Feature selection • Large margins... • Common hypothesis:Generate a single molecular signature
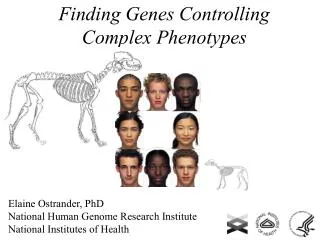
Introduction Complex Phenotypes • A single clinical phenotype may be caused by different molecular mechanisms • Our approach: discover several sub-classes in disease group • Each sub-class has a homogeneous molecular signature
Introduction Molecular Symptoms • Classical signatures are globally optimal • They have no biological focus • Genes are corregulated thus correlated in a global signature genes can be replaced with little loss • Molecular Symptom: • A functionally focused signature to identify a disease sub-class • High specificity – sub-optimal sensitivity
Subclass Subclass Another Molecular Symptom Control Molecular Symptom Control Control Diagnostic signature Introduction Molecular Patient Stratification • Patterns of molecular symptoms define a molecular patient stratification
Data Statistical Analysis Functional Annotations Data Statistical Analysis Functional Annotations Using Functional Annotations Using Functionl Annotations:A Priori vs. A Posteriori • Common procedure • Our suggestion
Using Functional Annotations Gene Ontology • Biological terms ina directed graph • Genes annotatedto terms • Levelsrepresentspecificityof terms
Using Functional Annotations Structured Analysis of Microarrays • Classification in leaf nodes • Regularized multivariate classifier • Local signatures • Diagnosis propagation • Combine child diagnoses in inner nodes • Generate more general diagnoses • Regularization • Shrink the classifier graph • Remove uninformative branches
Using Functional Annotations Leaf Node Classification • Shrunken centroid classification(Tibshirani et al. 2002) • Classificatino according to distance to centroids • Regularization via gene shrinkage • Determine probability-like values as classification results
Using Functional Annotations Propagation of Classification • Weighted averages • Weight according to child performance • Weights are normalized per inner node Pa w1 w3 w2 C1 C2 C3
Using Functional Annotations Graph Shrinkage • Weights of nodes are shrunken by a constant • Negative weights are set to zero uninformative branches vanish • Best shrinkage level chosen in cross-validation
Heterogeneity vs. Performance Biased Classifier Evaluation Calibration of Sensitivity and Specificity Shrinkage Parameter Worst Performance in Leaf Node Cj = DCi( j Dj )-1
Heterogeneity vs. Performance Classifier Heterogeneity • Difference between two classifiers:measures inconsistency of classifications • Node‘s redundancy: • Graph‘s redundancy(K nodes of the shrunken graph)
Heterogeneity vs. Performance Calibration • Sensitivity vs. Specificity: • Best classifiers: set to control prevalence • More molecular symptoms: set higher than control prevalence • Heterogeneity vs. Performance: • Molecular symptoms are heterogeneous • Thus high eliminates them
Evaluation on Cancer Related Data Leukemia Data Set • Data set by Yeoh et al. 2002 • Acute lymphocytic leukemia • 327 patients of 7 clinical sub-types • Expression profiles by HG-U95Av2 • Task for illustration • Detect MLL sub-type • 20 MLL samples • 109 test set / 218 training set
Evaluation on Cancer Related Data Functional Annotations • Focus on GO‘s Biological Process branch(8‘173 terms) • 12‘625 probesets on the chip • 8‘679 genes (68.7% of probesets) • In 1‘359 leaf nodes • 845 inner nodes (total 2‘204 nodes)
Evaluation on Cancer Related Data MLL Classifier • 2‘796 genes accessible through 32 nodes
Evaluation on Cancer Related Data MLL Stratification
Conclustions Conclusions • Semi-supervised classification • Datect sub-classes • In labelled disease groups • Functional annotation • Use in an a priori fashion • To find biologically focused signatures molecular symptoms • Resolve complex clinical phenotypes (stratification through molecular symptoms)