Microarray Analysis Software
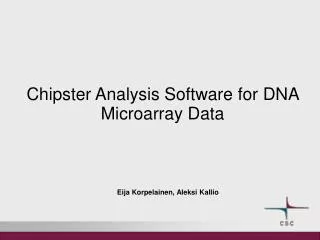
Microarray Analysis Software. Maximiliano Corredor Institute of Biology, Leiden University. Steps of a Microarray Experiment. Genomic sequence / EST library sequence. RNA. RT. Annotation. cDNA. labeling. cDNA-Cy3 / -Cy5. Probe design. hybridization. Image Processing. Statistical


Microarray Analysis Software
E N D
Presentation Transcript
Microarray Analysis Software Maximiliano Corredor Institute of Biology, Leiden University
Steps of a MicroarrayExperiment Genomic sequence / EST library sequence RNA RT Annotation cDNA labeling cDNA-Cy3 / -Cy5 Probe design hybridization Image Processing Statistical Analysis
Bioinformatic steps of MA experiments • Probre design • Image processing (with QC) • Normalisation (with QC) • Statistical analysis and data mining • Database management
Probe design software • Array Designer - a software that can design hundreds of primer for DNA or oligonucleotide microarrays, product of Premier Biosoft. http://www.premierbiosoft.com/dnamicroarray/index.html • OligoArray2 - a free software that computes gene specific oligonucleotides for genome-scale oligonucleotide microarray construction. http://berry.engin.umich.edu/oligoarray2/ • OligoWiz2 Server - server for designing oligonucleotide probes for microarrays. http://www.cbs.dtu.dk/services/OligoWiz2/ • ProbeWiz Server - The CBS ProbeWiz WWW server predicts optimal PCR primer pairs for generation of probes for cDNA arrays. http://www.cbs.dtu.dk/services/DNAarray/probewiz.php • Primer3 - a common used software for designing primers for microarray construction. http://frodo.wi.mit.edu/primer3/primer3_code.html
Image processing • Addressing: estimate location of spot centers • Segmentation: classify pixels as foreground or background • Information Extraction: for each spot on the array and each channel • Foreground intensities • Background intensities • quality measures
Image processing software GenePix Pro (Axon Instruments) for Windows • Spot identification, scatter plot, histogram, normalization, quality control http://www.moleculardevices.com/pages/software/gn_genepix_pro.html ScanArray (PerkinElmer) for Windows • Quantitation, spot quality measures and normalizationhttp://las.perkinelmer.com/Catalog/default.htm?CategoryID=Analysis+Software ScanAlyze (Eisen's lab, Lawrence Berkeley National Lab (LBNL). For Windows • Process fluorescent images of microarrays. Semi-automatic definition of grids and complex pixel and spot analyses. Free for academic http://rana.lbl.gov/EisenSoftware.htm TIGR Spotfinder (TIGR) for Windows • Spot identification; Microarray image processing. Free
QC: Background substraction • Background arises from glass autofluorescence, dust particles or washing defects • BG and specific hybridisation are assumed additive (but look at the image!!) • Low background can be substracted from the average intensity of the spot. • High background features should be removed from analysis: artificial saturation may occur and therefore the maximum measure is not the addition of background and real specific intensity. • Features with high negative intensities after background substraction (like those of the image) should also be removed. • Features with background similar to spot intensity will give a normal distribution centered in 0 intensity and can therefore be considered absent.
Background correction • Different types of background substraction • Possibility of flagging features that don’t match our QC criteria: - high background intensity- % of pixels above background - background higher than foreground
QC: Histogram and scatterplot The intensities should follow a normal distribution with: • Natural lower limit: only positive intensities exist (minimum RNA concentration is 0) • Long tail to the higher intensities • Artificial upper limit: saturation of detector and/or TIFF file. This can cause an accumulation of points at the highest intensity This effect can also be observed in the scatterplot
QC: Std. Dev. vs. Avg Good spots should be homogenous: low standard deviation • Linear correlation std. dev. vs average • Higher std dev = variability within spot • Lower std dev = uniformity within spot (saturation)
Sources of technical variability • PCR yield • DNA quality • spotting efficiency, • spot size • cross-/unspecific hybridization • stray signal • STOCHASTIC • Error model normalization • Chip production • efficiencies of -RNA extraction -reverse transcription -labeling -photodetection SYSTEMATIC • Calibration can correct for them
Normalisation • Several assumptions: • Normal distribution of intensities • All channels behave equally • Centering and scaling: • Intensities are transformed in a way that the averages and ranges are the same (and therefore comparable) • Within hyb normalisation: • In two channel data, both channels are centered and scaled. • More complex normalisations may be needed in order to ensure linearity along all intensities range. • Between hybs normalisation: • Every time that two or more different chips are going to be compared, it’s necessary that all of them are centered and scaled • Normalisation should be made taking into account the experimental design; error model must include distinction between experimental units, biological replicates and technical replicates
Normalisation software • Basic normalisation within hybridisation is possible in GenePix • Acuity includes more advanced normalization algorithms (Lowess, etc) • Rosetta implements several pipelines for normalization • Within hybs when uploaded to the database, using manufacturer indications for developing their error-models (providing therefore with p-values) • Between hybs when compared to each other (centering and scaling)
QC: M vs A • M stands for Log(Ratio); A is the product of the Log(Intensity) of both channels. • If the two channels behave symmetrically, everything is OK. Otherwise, we may have dye bias • It is very common to find such deviations in the tails of the distribution (lowess normalisation can help here).
QC: M vs A • Before normalisation (left), average ratio was higher than 0. • Intensity saturation of one channel produces skewed tail. This effect is not removed with normalisation, requires calibration of the image acquisition (or elimination of saturated spots from analysis)
QC and basic statistics software • Some image processing packages include basic statistics functions, like GenePix • Numerous stand-alone programs and plug-ins or scripts for more general statistical packages, like R/Bioconductor, Matlab, SPSS, MS Excel… http://ihome.cuhk.edu.hk/~b400559/arraysoft_statistics.html • All microarray analysis packages include this functions and many more
Database systems Acuity (Axon Instruments) • Runs on Windows 2000/XP client; Windows 2000 server (recommended) • Stores data in relational database, Microsoft SQL or Oracle • Various visualization tools; normalization; hierarchical, k-means, k-medians clustering with many different similarity metrics, SOM, PCA, gene shaving. • Scripting engine for customizable analysis http://www.moleculardevices.com/pages/software/gn_acuity.html ArrayDB (NHGRI) • Html/ linux or Unix • Analyzed expression data stored in a relational database • a software suite that provides an interactive user interface for the mining and analysis of microarray gene expression data. http://genome.nhgri.nih.gov/arraydb/
Database systems BASE (BioArray Software Environment) Department of Oncology, Lund University • Linux server, MySQL, web client • Manages biomaterial information, raw data and images, and provides integrated and "plug-in"-able normalization, data viewing and analysis tools. • The system also has array production LIMS features; support MIAME and MAGE-ML Rosetta Resolver (Rosetta Biosoftware) • JAVA/ UNIX with Oracle relational database • The Rosetta Resolver system combines advanced analysis software, a high-capacity database, and high-performance server framework in one enterprise-wide tool.
Database systems Stanford Microarray Database (SMD) package (Stanford University) • Oracle server; web server; UNIX with Perl support • SMD stores raw and normalized data from microarray experiments, as well as their corresponding image files. In addition, SMD provides interfaces for data retrieval, analysis and visualization. http://genome-www5.stanford.edu//download/ Longhorn Array Database (Institute for Cellular and Molecular Biology, University of Texas at Austin) • Linux and PostgreSQL • The Longhorn Array Database (LAD) is a MIAME compliant microarray database. It is a fully open source version of the Stanford Microarray Database (SMD) http://www.longhornarraydatabase.org/
Rosetta Resolver • Excellent database • But requires dedicated staff to maintain • Ideal for institutions and big companies • Who are the only ones able to afford it • Includes a good set of statistical tools • But it isn’t very transparent • GUI user-friendly(ish) • Flexible advanced statistics available as visual scripts and R implementation • However this requires deep knowledge of the DB structure and some programming skills • Compatible with multitude of data formats • But hard to get info out of the system (no MIAME yet)
Statistical Analysis and Data Mining • Basic output of a microarray experiment is a list of genes differentially transcribed. This can be obtained easily (Excel) from the image processing. • However the list is arbitrary: fold-change values are arbitrarily chosen and there is no measure of the significance of the observed difference: to do science we need statistics • Many packages like Acuity, BASE and Rosetta Resolver combine database and statistical analysis tools, but there are also many other programs exclusively devoted to the statistical analysis of microarray experiments: http://ihome.cuhk.edu.hk/~b400559/arraysoft_mining_comprehensive.html
Statistical analysis and Data mining software • GeneSpring (Silicon Genetics) Analyze various array types, scatter plot, cluster analysis, PCA, SOM, statistic tools, 2D, 3D plotting • J-Express (MolMine) Hierarchical clustering, K-means particional clustering, Principal component anlaysis, Self-organizing maps, Profile similarity search, Normalization and filtering, Raw data import, Project organization. Free for academics • BioConductor, an open source software project providing infrastructure in terms of design and software for analysing genomic data, some form of graphical user interface for selected libraries. For other microarray related R packages: http://ihome.cuhk.edu.hk/~b400559/arraysoft_rpackages.html • SpotFire (Spotfire) Hierarchical, bi-directional hierarchical and K-means cluster analysis, PCA, profile search, coincidence testing, normalization, a number of interactive plots for visualization of data, access GATC databases
Classification tasks for microarrays • Classification of SAMPLES Generate gene expression profiles that can (i) discriminate between different known cell types or conditions, e.g. between tumor and normal tissue, (ii) identify different and previously unknown cell types or conditions, e.g. new subclasses of an existing class of tumors. • Classification of GENES (i) Assign an unknown cDNA sequence to one of a set of knowngene classes. (ii) Partition a set of genes into new (unknown) functional classes on the basis of their expression patterns across a number of samples. • Discriminant analysis: CLASSES KNOWN • Cluster analysis: CLASSES NOT KNOWN
Cluster analysis • Grouping a collection of objects into subsets or “clusters”, such that those within each cluster are more closely related to one another than objects assigned to different clusters. • Two ingredients are needed to group objects: • Distance measurement • Clustering algorithm • Clustering columns: grouping similar samples • Clustering rows: grouping similarly expressed genes
Clustering of genes • Genes with similar patterns of expression (synexpression groups) cluster together. • Synexpression groups may be functional groups (this is a hypothesis that always has to be tested). Iyer et al., Science 1999
Clustering of samples • Provided enough number of samples, functional relationships might be found Golub et al. http://www.genome.wi.mit.edu/MPR
Useful links • http://ihome.cuhk.edu.hk/~b400559/arraysoft.html Comprehensive recopilation of information on microarray software • https://www.cs.tcd.ie/Nadia.Bolshakova/softwaretotal.htmlCatalogue of microarray analysis software • http://genome-www5.stanford.edu/resources/restech.shtmlStanford Microarray Database Software and Tools • http://www.tigr.org/software/microarray.shtmlThe Institute for Genomic Research Microarray Software