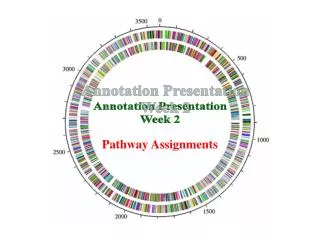
Tutorial session 2 Network annotation
Tutorial session 2 Network annotation. Exploring PPI networks using Cytoscape EMBO Practical Course Session 8 Nadezhda Doncheva and Piet Molenaar. Overview. Focus: Network annotation and visualization Loading and manipulating attributes Identifier mapping Mapping data onto the network

Tutorial session 2 Network annotation
E N D
Presentation Transcript
Tutorial session 2Network annotation Exploring PPI networks using Cytoscape EMBO Practical Course Session 8 Nadezhda Doncheva and Piet Molenaar
Overview • Focus: Network annotation and visualization • Loading and manipulating attributes • Identifier mapping • Mapping data onto the network • Use visuals to convey data • Concepts • Vizmapper • Data • Human Neuroblastoma mutated genes list
Attributes • Nodes and edges can have attributes associated with them • Gene expression data • Mass spectrometry data • Protein structure information • Gene Ontology terms, etc. • Cytoscape supports multiple data types: Numbers, Text, Logical, Lists...
Loading attributes • Use pre-formatted attribute files • Import attribute from table • Excel file • Comma or tab delimited text • Import attribute from web services • NCBI Entrez Gene • Ensembl Biomart • Use ‘import attribute or expression matrix’ • Create attributes manually in the attribute browser
Use Case 2.1: Neuroblastoma • Childhood neuro endocrine tumor • Young children • Variable clinical outcome • Low stages • Good prognosis • Numeric changes of chromosomal copy numbers • High stages • Poor prognosis • Structural chromosomal defects (LOH1p / 11q etc) • Few gene defects identified • MYCN amplification (20%) • ALK activation (7%) • CCND1 / PHOX2B / NF1
Use Case 2.1: Neuroblastoma • Poor prognosis • Subgroup (~1/3) characterized by MYCN amplification • Rest unknown
Use case: Assignment 2.1 • Whole genome sequence of 86 tumor vs blood • 1043 genes with mutations • Load the list of genes (neuroblastoma_mutated_symbols.txt) as a network • Use the tab separated dataset (neuroblastoma_mutated_annotations.txt) to map additional information • Make sure the attributes have informative names http://cytoscape.org/manual/Cytoscape2_8Manual.html#Import Attribute Table Files
Assignment 2.1 results • Load the list; use the same importer • No interactions yet • Load the annotations • Check text import settings • Check mapping settings
Attribute management Different type of attributes: Strings, Numbers, … Select attributes for display Node or Edge ID Specific Attribute Tabs: for Nodes, Edges, and Network
Tips & Tricks: Root Graph and sessions • ”There is one graph to rule them all...” • The networks in Cytoscape are all ”views” on a single graph. • Changing the attribute for a node in one network will also change that attribute for a node with the same ID in all other loaded networks • There is no way to ”copy” a node and keep the same ID Make a copy of the session
Identifier mapping • Identifiers (IDs) are ideally unique, stable name or numbers • But: too many IDs and different database records for Gene, DNA, RNA, Protein • The ID Mapping challenge: • Avoid errors by mapping IDs correctly • Gene names are ambiguous • Excel introduces errors • Problems reaching 100 % coverage • Recommendations (for proteins and genes): • Map everything to Entrez Gene IDs using a spreadsheet • Manually curate missing mappings to achieve 100 % coverage • Be careful of Excel auto conversions
Use case: Assignment 2.2 • Use the Biomart plugin to map UniProt identifiers on the genes http://cytoscape.org/manual/Cytoscape2_8Manual.html#Node Name Mapping
Assignment 2.2 results • Use the Ensemble 68 set • Input data type is HGNC symbols • Import more than just the UniProt IDs
Data mapping • Mapping of data values associated with graph elements onto graph visuals
Data mapping • Visual attributes • Node fill color, border color, border width, size, shape, opacity, label • Edge type, color, width, ending type, ending size, ending color • Mapping types • Passthrough (labels) • Continuous (numeric values) • Discrete (categories) • Visual style
VizMapper List of Visual Styles Default Visual Style editor List of Data attributes List of Visual attributes Mapping definition
Tips & Tricks: Data mapping • Avoid cluttering your visualization with too much data • Map the data you are specifically interested in to call out meaningful differences • Mapping too much data to visual attributes may just confuse the viewer • Create multiple networks and map different values
Use case: Assignment 2.3 • Map the size of the nodes to the number of occurrences • Map color to the tumor ids • Hint: use a rainbow pattern http://cytoscape.org/manual/Cytoscape2_8Manual.html#Visual Styles
Assignment 2.3 results • Use gradient • Readily shows higher number of mutations • Use rainbow • Similar names, similar colors
Exploring expression data • VistaClara plugin • Exploratory data analysis of multi-experiment microarray studies • A graphical and interactive alternative to the standard attribute browser
Filtering & editing data • Use filters • QuickFind nodes and edges • Index the network based on a node or edge attribute • Dynamic filtering for numerical attributes • Build complex filters using AND, OR, NOT relations • Define topological filters (considers properties of near-by nodes) • Create subnetworks
Use case: Assignment 2.4 • What is the gene with most mutations? • Filter the network for genes with more than one mutation (why?) and save the new network. • Use the Bisogenet plugin... • ...to find interactions among these • ...to find interactions among these and their first neighbours (or explore different settings of Bisogenet according to your taste) • Store your session for later use http://cytoscape.org/manual/Cytoscape2_8Manual.html#Finding and Filtering Nodes and Edges http://bio.cigb.edu.cu/biso/BisoGenet_User_Manual.pdf
Assignment 2.4 results • MYCN • Frequently amplified; no additional information • More likely not to be bystander
Assignment 2.4 results • MYCN • Frequently amplified; no additional information • More likely not to be bystander • Bisogenet • Between: Only large genes • Neighbours: Promising hairball
To be continued… • Build, visualize and analyze your own network with Cytoscape • Network generation • Network annotation and visualization • Network analysis • Identify active subnetworks • Analyze Gene Ontology enrichment • Perform topological analysis • Find network clusters • Find network motifs