RADAR IMAGERY
RADAR IMAGERY. MSC 243 Lecture #4 9/17/2013. Overview. What is Doppler radar? How does radar work? What does radar measure? Limitations How does radar help in weather forecasting/ nowcasting ? Different types of weather radar. Doppler Radar. Remote Sensing instrument (like satellites)

RADAR IMAGERY
E N D
Presentation Transcript
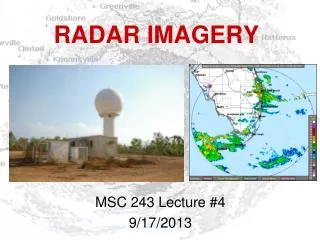
RADAR IMAGERY MSC 243 Lecture #4 9/17/2013
Overview • What is Doppler radar? • How does radar work? • What does radar measure? • Limitations • How does radar help in weather forecasting/nowcasting? • Different types of weather radar
DopplerRadar • Remote Sensing instrument (like satellites) • “RAdioDetection And Ranging” • Active sensor: Sends an electromagnetic pulse • When the pulse hits an object, the energy is scattered. Some of this energy is scattered back towards the radar • Can determine location and size of object • Using Doppler theory, can determine motion of object • The objects can be anything in the atmosphere, including airplanes, birds, insects, raindrops, snowflakes, hail stones, etc.
Types of Ground Radar Phased-Array System -less common, more sophisticated -Used by military and scienceresearch Will likely replace WSR-88s in future NEXRAD WSR-88Dsystem -(NEXt Generation RADar) - Weather Surveillance Radar -National Weather Service This Lecture
Radar Scanning Pattern 2 Range modes: 143/286 miles ANEXRAD WSR-88D radar antenna is pointed at a low angle, sends out a pulse for a fraction of a second, and then "listens" to receive any returning energy or "scattering." Then the radar rotates an incremental amount and repeats the process. Once the radar completes an entire revolution, the antenna elevation angle is increased and the process is repeated. Radars transmit and listen so quickly that they can scan much of the nearby atmosphere in about 5 minutes.
Clear Air Mode • Used when no significant precipitation in area • To examine very light precipitation (or other particles) • To detect subtle boundaries or fronts Fewer elevation levels, more time for ‘listening’
Ground Clutter Echoes from surface targets appear in almost all radar reflectivity images. In the immediate area of the radar, "ground clutter" generally appears within a radius of 20 nm. This appears as a roughly circular region with echoes that show little spatial continuity. It results from radio energy reflected back to the radar from outside the central radar beam, from the earth's surface or buildings, or bugs!
Precipitation Mode • Used when precipitation is occurring or expected in the forecast area • Scans more levels at higher frequency, to quickly receive information about the atmosphere, but is less sensitive More elevation levels, uses PRF = Pulse Repetition Frequency
Light Rain Heavy Rain Precipitation Mode
http://radar.weather.gov Read the FAQ! Southeast Florida Radar Loop: http://andrew.rsmas.miami.edu/bmcnoldy/radar/kamx/ Hurricane Radar Loops: http://andrew.rsmas.miami.edu/bmcnoldy/tropics/radar/
Radar Measurements (1) Precipitation: • Main use of radar • Measurement of precipitation intensity and distribution. • Radar measures power of signal (“echoes”) which is converted to REFLECTIVITY. (2) Radial Wind Velocity: • Can detect winds moving towards (green) or away (red) from radar • Helps identify the rotation of storms, and is useful in detecting possible tornado outbreaks.
(1) RadarReflectivity Measuring Precipitation • Larger raindrops higher reflectivity • More raindrops higher reflectivity • Reflectivity (labeled Z) is empirically related to rainfall rate R via a “Z-R relationship”: Z=300 R1.4 • This relationship is not always accurate, since R depends on (i) raindrop size, (ii) raindrop distribution, (iii) fall velocity, (iv) type of precip. • Need a special Z-R relationship for tropical rainfall. • There are 4 precipitation products: (i) base, (ii) composite, (iii) 1-hr total, (iv) storm total
(i) Base reflectivity Taken from the lowest (½°) elevation scan (ii) Composite reflectivity The strongest returned energy for each elevation angle in a volume scan is compiled into one image. This can reveal important storm structure features and intensity trends of storms CAUTION: Take care when interpreting radar images! Not all precipitation reaches the ground, and not all radar echoes are caused by precipitation.
(iii) 1-hr Total Estimated one-hour precipitation accumulation. It is used to assess rainfall intensities for flash flood warnings, urban flood statements and special weather statements (iv) Storm Total (Ophelia, 2005) Estimated accumulated rainfall, continuously updated, since the last one-hour break in precipitation. This product is used to locate flood potential over urban or rural areas, estimate total basin runoff and provide rainfall accumulations for the duration of the event
Range Modes SHORT RANGE (143 miles) LONG RANGE (286 miles) • Due to the curvature of the earth, and the beam angle, the beam height increases with distance from the radar. • This can result in underestimating the strength and intensity of distant storms
Beam Blocking • Physical obstacles (e.g. mountains) can prevent the radar beam from reaching the full range, creating a “radar shadow”. • Can create dangerous situations involving heavy rain or snow in mountainous terrain.
Radar Derived Precipitation dBZRainrate (in/hr) 65 16.0+ 60 8.00 55 4.00 52 2.50 47 1.25 41 0.50 36 0.25 30 0.10 20 Trace KMLC 201453Z AUTO 17018G26KT 7SM RA OVC032 18/18 A2998 RMK AO2 PK WND 17026/1451 LTG DSNT SE AND S TSE32 PRESFR SLP144 P0014 60020 T01830178 58013= KPRX 201455Z AUTO 04004KT TS 18/17 A3011 RMK AO1 LTG DSNT ALQDS P0159 60159 52027=
New! Dual-Polarization Technology • NOAA’s National Weather Service finished upgrading its network of 160 Doppler radars across the nation with this new technology in April 2013. • Polarimetric radars, also called “dual-pol” radars, transmit radio wave pulses that have both horizontal and vertical orientations. ANIMATION ANIMATION
Benefits of “Dual-Pol” Technology • Dual-pol radars improve: • Determination of snow vs. rain vs. melting snow - improving forecasts of liquid water equivalent or snow depth • Determination of hail vs. areas of heavy rain • Detection of debris from tornadoes • Identification of non-weather objects http://weather.cod.edu/satrad/nexrad/index.php?type=AMX-N0Q-0-6#
New Products from Dual-Pol Differential Reflectivity – The differential reflectivity is a ratio of the reflected horizontal and vertical power returns. Among other things, it is a good indicator of drop shape. In turn the shape is a good estimate of average drop size. Correlation Coefficient– A statistical correlation between the reflected horizontal and vertical power returns. It is a good indicator of regions where there is a mixture of precipitation types, such as rain and snow. Linear Depolarization Ratio– This is a ratio of a vertical power return from a horizontal pulse or a horizontal power return from a vertical pulse. It, too, is a good indicator of regions where mixtures of precipitation types occur. Specific Differential Phase – The specific differential phase is a comparison of the returned phase difference between the horizontal and vertical pulses
Video: http://www.nws.noaa.gov/com/weatherreadynation/news/080212_dual.html
(2) Radial Wind Velocity • Measures the component of the wind moving towards or away from the radar look direction
Doppler Effect • The Doppler Effect is the change in frequency of waves when the source of the waves is in motion. (The frequency of sound waves determines their pitch) • The phase shift in the scattered radar pulse gives an estimate of the wind speed, towards or away from the radar station. http://www.meted.ucar.edu/radar/basic_wxradar/media/flash/doppler_sound.swf Doppler Effect Video
Radar Measured Winds • Red indicates winds moving AWAY from the radar • Green indicates wind moving TOWARDS the radar • Grey indicates winds moving PERPENDICULAR to the radar • …orno wind • Purple indicates range-folded areas (where the radar is unable to determine the radial velocity)
Understanding Radial Winds • Wind direction can be estimated from the GREY regions, where the wind velocity is perpendicular to the radar • In this example, the eye of a hurricane is situated south of the radar. Winds are flowing westward here, following a cyclonic rotation around the eye. • Closer to the radar, wind direction is different (pointing more towards the eye). Why is this?
Wind Velocity Products Base Velocity The measured winds at the base elevation. (ii) Storm Relative Motion The motion of the storm is subtracted from the wind field. The result is a picture of the wind as if the storms were stationary
Observing Severe Weather Tornadoes are often located at the center of a hook-shaped echo on the southwest side of thunderstorms. Tornado Vortex Signature (TVS) indicates where wind directions are changing within a small area and there is rotation.
Different Types of Radar List is not exhaustive! • WEATHER • NWS Doppler Radar Precipitation • Doppler Cloud Radar Clouds • Aircraft Radar Storm winds • OCEAN • High Frequency Radar • Ocean Surface Currents
UM/RSMAS Doppler Cloud Radars • Short wavelength (λ=3-8 mm) compared with WSR-88D (wavelength 3-10 cm) • High sensitivity (radar sensitivity is proportional to 1/ λ4) allows them to detect cloud droplets (conventional radars detect precipitation) • Sampling in upward facing mode provides cloud structure in column above and Doppler velocities (updrafts and downdrafts) • Small size allows deployment on ships, aircraft, and satellite (CloudSat) UM Cloud radar making observations of fair weather cumuli
Observations of Anvil with MammatusClouds HOURS Time-height mapping of radar reflectivity (top) and mean Doppler velocity (bottom) of the cloud that produced the mammatus clouds. ZOOM OF VERTICAL VELOCITY
CloudSat Cloud Profiling Radar • Space-based radar with short wavelength (λ=3 mm) was chosen for optimal antenna size and power usage. Figures from: Schubert, W. H., and B. D. McNoldy, 2010: Application of the concepts of Rossby length and Rossby depth to tropical cyclone dynamics. J. Adv. Model. Earth Syst., 2, 13pp., doi:10.3894/JAMES.2010.2.7.
As Irene makes landfall along the Outer Banks of North Carolina (outlined in black across the center of the images) NOAA P-3 missions continue to collect airborne Doppler radar data to use in initializing and evaluating model guidance. Included here you see images of the horizontal winds within the inner core of Hurricane Irene sampled from the tail Doppler radar on the P-3 early on 27 August 2011 showing the center right on the coast. These images are at three altitudes, 1 km, 5 km, and 10 km, using a composite of winds from all three legs oriented west-east, north-south, and east-west. The trends seen in the last few analyses continue. The very broad area of strongest winds is on the east-northeast side of the storm at 1-km altitude and rotates upwind at 5- and 10-km altitude indicative of increasing southwesterly winds aloft. The radius of this broad wind maximum remains fairly similar to the last analyses, with two other wind. Maxima evident to the east of the center suggesting an expansion of the wind field on the east side to much larger radii. There is still no noticeable tilt in the center of the circulation from 1- to 10-km altitude, however the wind field is more asymmetric making the center harder to define above 5 km, suggesting that Irene is encountering steadily increasing vertical shear of the horizontal wind from the west-southwest. Also visible in the analyses is a continued decrease of scatterers at 10 km altitude, particularly south of the center, suggesting that the convective activity is focussed in the region effected by the onshore flow. This analyses is the final one for Irene as the storm moves too close to shore for aircraft to sample effectively. Ground based Doppler radar provide the best coverage in these situations. All the Irene radar composites at 0.5-km height resolution and gridded data are available at http://www.aoml.noaa.gov/hrd/Storm_pages/irene2011/