Download
1 / 24
240 likes | 390 Views
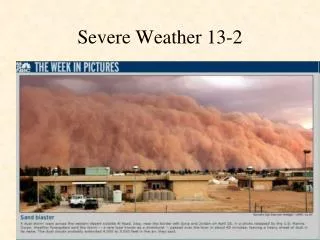
Exposure to Severe Weather Events: A review of recent experience in the Western Cape. Ailsa Holloway, Gillian Fortune,. Disaster Mitigation for Sustainable Livelihoods Programme University of Cape Town September, 2009. Presentation Focus. Southern Cape 2006.

E N D
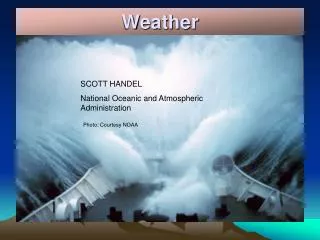
Exposure to Severe Weather Events: A review of recent experience in the Western Cape Ailsa Holloway, Gillian Fortune, Disaster Mitigation for Sustainable Livelihoods Programme University of Cape Town September, 2009
Presentation Focus Southern Cape 2006 • Role of ex post analysis in managing climate risk • Overview of recent severe weather in Western Cape • Reflection on severe weather & consequences for flood risk management. • Unpacking ‘ causal chain’’ between ‘development’ and severe weather impacts Knysna 2007 Port Shepstone 2008
Managing Risk – Role of Ex Post Analysis • Risk is a probalistic concept – about a future negative outcome (it has yet to happen) • ‘Ex post’ disaster event research analyses actual events that have happened.
It provides useful insights about: • What/who resists and what fails in a severe weather event. The ‘what’, the ‘where’ and the ‘when’ and the ‘who’ • How much this costs • The causal chain that leads to the loss (ie the mix of risk factors) the ‘why’ and the ‘how’ • Ex post research studies actual disaster events to guide risk averse development
Severe Weather Events for 2003, 2004, 2005, 2006, 2007 and 2008 2003 241 mm 218mm 2004 228mm 2005 324mm 2006 150 mm 2007 - June 206 mm 2007 - Nov 2008 - July 93 mm 2008 - Nov 150 mm
Severe weather events - costly for W. Cape * Not adjusted for inflation
Focus on Cut-off Lows Affecting Eden ie Prov. Depts and Municipal Impacts Severe weather losses 2003 - 2008
Provincial losses are substantial (2003, 2006 & 2007 weather events total R 1.2 bn) 2007 losses up by more than five times March 2003
A Review of Ten Damage-Bearing Severe Weather Events Since 2003 Cape Town August 2004 and 2008 W. Coast June 2007, July 2008 Winelands/ March 2003, April 2005, Overberg November 2008 Eden December 2004, August 2006 November 2007
Cape Town – August 2004 and 2008 A little history… Image from 23 June, 1904 62.5 mm fell in one hour
100 years later…5-9 August 2004 (2 large cold fronts) • Resulted in flooding in Maitland, Woodstock, Pinelands, Athlone, Bonteheuvel, Nyanga, Guguletu and Somerset West (Mainly Salt Water Catchment) • Peak rainfall intensities over 3 hr durations exceeded 100 year storm Athlone (67mm) & Pinelands (62 mm) Source: CoCT in 2004 Storm Report onwww.egs.uct.ac.za
Cape Town Superstorm, 30-31 August 2008 100mm 24 hour rainfall, 30 August 2008 (46% August monthly rainfall – 24 hrs) Source: Thea Beckman, UCT Storm surge > 5 m and wave heights > 7 metres; Images www.news24.com
West Coast June 20076-11 June (Cut-off low), 25-26 June (Frontal system) • First event … rainfall over Bergriver Municipality > 130 mm (but total rain 280-318mm); Swartland (120mm) Saldhana Bay (110 mm) • Second event … Rainfall over Witzenberg Municipality > 50 mm • Combined totals for June 2007 … 200 mm greater than mean historical average Roode Els Berg 289 mm Assegaibos 328 mm Ceres 394 mm Hawequas 219 mm Jonkershoek 198 mm
West Coast and Western Winelands 4 – 9 July 2008 (Cut off low) • Most striking feature – long duration of heavy precipitation. • Wettest July in recent history for Ceres, Roode Els Berg • July 2008 totals were 300% (Roode Els Berg), 145% (Assegaibos) and 200% (Ceres) of July mean rainfall
2003 and 2005 Winelands and OverbergCut-off Lows • 22-25 March 2003 ‘Montagu floods’ 241 mm in Montagu, (Kingna River – mainly responsible for flooding) 160 mm in Swellendam • 10-12 April 2005, ‘Bredasdorp flood’ 228 mm rain
11-13 November 2008 Cut off Low – Overberg and Winelands • Meterologically, less significant than 2007 cut-off low during the same month. • However, still significant losses – and research now ongoing Korinte-vetdam 281 mm Hawequas Forest 250 mm
Eden - December 2004, Jul/August 2006, November 2007 Cut-off lows 21 – 23 December 2004 (Heidelberg 168 mm, Knysna 219 mm) Flood line inside a house on the Duiwenhoks River Heidelberg Municipal Chalets 22 Dec, 2004
Jul/August 2006 George Rainfall 31 Jul – 4 Aug 2006 328 mm PLUS 21 – 24 Aug 2006 118 mm Total 446 mm
2006 Cut-off low profiled exposures generated by non-perennial floodways that flash-flood in a severe weather event Source: Xavier Middleton
1957 to 1985 It also indicated the role of increasing urbanisation in George Municipality from 1957 to 2004… 1957 1985 to 2004 Increased by 728.28 hectares from 1957 to 1985 Source: Xavier Middleton Increased by 7,488.4 hectares from 1985 to 2004
21-22 November 2007 Cut-off Low This 3-day event created new rainfall records for areas it affected: Contributed over 70% to highest November total rainfall in the last 30 years Assegaibos – 500% and George 530%, respectively of the November mean. Wolwedansdam 316 mm George 333 mm
Institutional risk factors (ie under- investment in municipal maintenance)
Investments in municipal maintenance are protective and reduce losses
To conclude: • Severe weather is a reality for us in the Western Cape – no region can be complacent. • There has been impressive improvement in managing severe weather since 2003 … especially in mobilising following warnings. • However… still a long way to reducing climate risk developmentally..